• Photonics Research
  • Vol. 9, Issue 10, 2037 (2021)
Jing Liu1、5、*, Flavia Artizzu2、3、6、*, Min Zeng2, Luca Pilia4, Pieter Geiregat2, and Rik Van Deun2
Author Affiliations
  • 1Key Laboratory of Luminescence Analysis and Molecular Sensing, Ministry of Education, School of Materials and Energy, Southwest University, Chongqing 400715, China
  • 2Department of Chemistry, Ghent University, B-9000 Ghent, Belgium
  • 3Department of Sciences and Technological Innovation, University of Eastern Piedmont “Amedeo Avogadro”, 15121 Alessandria, Italy
  • 4Department of Mechanical, Chemical and Material Engineering, University of Cagliari, 09123 Cagliari, Italy
  • 5e-mail: jingliu77@swu.edu.cn
  • 6e-mail: flavia.artizzu@ugent.be
  • show less
    DOI: 10.1364/PRJ.433192 Cite this Article Set citation alerts
    Jing Liu, Flavia Artizzu, Min Zeng, Luca Pilia, Pieter Geiregat, Rik Van Deun. Dye-sensitized Er3+-doped CaF2 nanoparticles for enhanced near-infrared emission at 1.5 μm[J]. Photonics Research, 2021, 9(10): 2037 Copy Citation Text show less

    Abstract

    Lanthanide (Ln)-doped nanoparticles have shown potential for applications in various fields. However, the weak and narrow absorption bands of the Ln ions (Ln3+), hamper efficient optical pumping and severely limit the emission intensity. Dye sensitization is a promising way to boost the near-infrared (NIR) emission of Er3+, hence promoting possible application in optical amplification at 1.5 μm, a region that is much sought after for telecommunication technology. Herein, we introduce the fluorescein isothiocyanate (FITC) organic dye with large absorption cross section as energy donor of small-sized (3.6 nm) Er3+-doped CaF2 nanoparticles. FITC molecules on the surface of CaF2 work as antennas to efficiently absorb light, and provide the indirect sensitization of Er3+ boosting its emission. In this paper, we employ photoluminescence and transient absorption spectroscopy, as well as density functional theory calculations, to provide an in-depth investigation of the FITCEr3+ energy transfer process. We show that an energy transfer efficiency of over 89% is achieved in CaF2:Er3+@FITC nanoparticles resulting in a 28 times enhancement of the Er3+ NIR emission with respect to bare CaF2:Er3+. Through the multidisciplinary approach used in our work, we are able to show that the reason for such high sensitization efficiency stems from the suitable size and geometry of the FITC dye with a localized transition dipole moment at a short distance from the surface of the nanoparticle.

    1. INTRODUCTION

    Due to the unique optical nature of lanthanide ions (Ln3+), characterized by sharp and narrow emission bands and long-lived luminescence, Ln3+-based materials have been widely used in amplifiers, lasers, and biosensors [16]. Ln3+ luminescence can be roughly divided into three types according to different spectral conversion mechanisms: upconversion, an anti-Stokes process where at least two lower-energy photons are converted into a higher-energy photon; downconversion, the inverse process of upconversion, where a higher-energy photon is converted into two low-energy photons; and downshifting, the process where a higher-energy photon is transformed into a lower-energy photon [7,8]. The latter phenomenon is of high importance in several technological applications in the near-infrared (NIR) spectral range. In particular, the 1.5 μm downshifted luminescence emission of Er3+ plays a vital role in information and telecommunication technologies [9,10]. However, currently exploited Er3+-doped fiber amplifiers (EDFAs) present a drawback derived from the narrow and weak absorption cross section of the Ln3+, resulting in rather inefficient optical pumping [11]. To improve the absorption, organic dyes working as antennas can be introduced into Er3+-based materials, owing to the broader absorption spectra and larger absorption cross sections of dye molecules [1214]. For this reason, erbium complexes with organic “antenna” ligands have become popular in this field [3]. However, these materials suffer from severe vibrational quenching of the NIR emission due to the presence of groups such as -OH, -NH, and -CH, native to the organic moiety in the immediate surroundings of the metal emitter [15]. Therefore, a “hybrid” organic–inorganic approach where the Ln ions are embedded in a low-phonon inorganic matrix, such as a fluoride nanoparticle, which is surface-grafted with an organic “antenna” dye, seems a promising strategy to achieve the light-harvesting properties typical of Ln molecular complexes while protecting the Ln emitter from environmental quenching effects [16].

    Recently, various combinations of dye-sensitized Ln3+-doped upconversion and downconversion nanoparticles have been reported, owing to the attainable high-emission intensity and the potential interest in photonic and biological applications [1719]. The efficiency of the energy transfer (ET) at the organic–inorganic interface in dye-sensitized Ln3+-doped nanoparticles has been a central theme in the field in the last few years. For instance, Xue and coauthors showed that a detrimental energy back transfer phenomenon exists in the IR-806 sensitized NaYF4:Yb3+, Er3+@NaYF4:Nd3+ upconversion nanoparticles [17]. The same authors also pointed out that the optimization of the ratio of the acceptor upconversion nanoparticles to donor dyes is the key to gain efficient dye sensitization. Garfield et al. also reported a dramatic enhancement of the upconversion luminescence intensity and efficiency in comparison with the bare NaYF4:Er3+, Yb3+ upconversion nanoparticles following the activation of a resonant triplet of dye molecules [18]. Wang and Meijerink postulated dye-sensitized Pr3+Yb3+ downconversion luminescence in NaYF4 nanocrystals, showing that Förster resonance ET from the coumarin dye to Pr3+ leads to around 30 times increase in the Yb3+ NIR emission at 980 nm [19]. Nonetheless, the research on dye-sensitized downshifted NIR emission remains relatively unexplored, and to the best of our knowledge, the study of Er3+ NIR downshifting luminescence in dye-sensitized nanoparticles has not been reported up to date, despite its remarkable technological relevance. Moreover, the understanding of the factors that govern ET phenomena at the organic–inorganic interface of hybrid Ln NPs still requires further clarification.

    In this work, we present the synthesis, emission properties, and a deep investigation of the photocycle of ultrasmall (<3.6  nm) Er3+-doped CaF2 nanoparticles sensitized by fluorescein isothiocyanate (FITC). FITC is a popular dye in biological labeling because of its high absorptivity, with an extinction coefficient of 7.3×10¹⁶  cm2 at λmax=500  nm and high emission quantum yield of 30% [20,21]. It displays visible (Vis) yellow-green light emission and provides pump channels across a spectral region from ultraviolet (UV) to Vis, and it is thus optimal as a sensitizer of Er3+-doped fluoride [2123]. Cubic CaF2 is one of the most efficient host materials for Ln luminescence, providing a low phonon energy (<350  cm1) host and high viability for doping, since the radius of Ca2+ is close to that of Ln3+ [2427]. In the investigated system, the ultralow dimensionality of the doped CaF2 nanoparticles, achieved by employing the thermal decomposition synthesis method, is of particular importance to limit the spatial separation between the energy donor dye and the accepting dopant ion to maximize ET efficiency [6,28]. Density functional theory (DFT) calculations allowed for an in-depth description of the structural and electronic properties of the FITC dye upon binding to the nanoparticles, which greatly influence its optical features. We investigated the photocycle mechanism in detail by using time-resolved and steady-state photoluminescence (PL) and femtosecond transient absorption (TA) spectroscopy, providing information on the luminescence dynamics both from bright (radiative) and dark (nonradiative) states. On the basis of the retrieved experimental results, the implementation of the Förster’s model of resonance ET and molecular modeling, we were able to shed light on the main factors governing the dye to Er3+ sensitization pathway to reach exceptionally high efficiency.

    2. EXPERIMENT

    A. Synthesis

    Ca(CF3COO)2 and Ln(CF3COO)3 were prepared as described in a previous work [6]. Oleic acid (OA), oleylamine (OM), 1-octadecence (ODE), and FITC were purchased from Sigma Aldrich.

    Monodisperse CaF2 was synthesized by reported thermal decomposition method [29,30]. 1 mmol Ca(CF3COO)2 was mixed with 1.6 mL of OA, 1.6 mL of OM, 3.2 mL of ODE in a 50 mL three-neck flask. The mixture was heated to 120°C under nitrogen flow with vigorous stirring for 40 min; then the temperature was increased to 150°C and retained for 30 min to form a clear yellowish solution. Afterwards, the solution was continually heated to 310°C for 20 min, and then cooled down naturally to room temperature. The resulting solution was washed and precipitated by addition of ethanol several times, and finally redispersed in the cyclohexane.

    CaF2:Ln3+ was prepared in a similar manner to CaF2, except using 0.7 mmol Ca(CF3COO)2 and 0.3 mmol Ln(CF3COO)3 reagents instead of 1 mmol Ca(CF3COO)2.

    FITC-functionalized CaF2 or CaF2:Ln3+ nanoparticles were synthesized as follows. CaF2 or CaF2:Ln3+ nanoparticles in chloroform (12 mg/mL) were mixed with an FITC chloroform solution (0.3 mg/mL). The suspension was stirred constantly for 15 h at 50°C. The final products were washed with acetonitrile several times, and then redispersed in chloroform. The number of nanocrystals (NNC) of CaF2:30%Er3+ (116.22 g/mol) contained in 6 mg of sample is estimated to be (6/116.22)×103  μmol=51.63  μmol. After the washing procedure, the total amount of FITC dye, determined through absorption spectroscopy, was 602.93 μmol. The number of FITC molecules per nanoparticle is therefore estimated to be 602.93/51.63 = 12.

    B. Characterization

    Powder X-ray diffraction (XRD) patterns were recorded on a Thermo Scientific ARL X’TRA diffractometer in the range of 20°–70° 2θ. Transmission electron microscopy (TEM) measurements were obtained by using a Cs-corrected JEOL JEM-2200FS operated at 200 kV. The optical properties of all samples were investigated as chloroform solutions or dispersions with a slight excess of triethylamine to ensure that the FITC dye was present in the fully deprotonated, dianionic form. The absorption spectra were collected with a PerkinElmer Lambda 900 UV-Vis-NIR spectrometer. The steady-state and time-resolved PL measurements were carried out on an Edinburgh FLSP 920 UV-Vis-NIR spectrofluorometer. All data were normalized for the absorbed power at excitation wavelength. TA spectra were recorded by exciting suspensions of CaF2:Ln3+ nanoparticles using 110 fs pulses at 500 nm created from an 800 nm Spitfire Ace Spectra-Physics Ti:S laser through nonlinear conversion in a TOPAS optical parametric amplifier. The probe is obtained through white-light generation in a CaF2 crystal and spans the UV-Vis region. The noise levels of 0.1 mOD (RMS) were obtained by averaging over 5000 shots per time delay.

    C. Theoretical Calculations

    The ground-state electronic structures of FITC as free dianion and coordinated to a Ca2+ ion were calculated at DFT [31] level of theory using the B3LYP functionals [32,33] implemented in the Gaussian 16 [34] software package. The ground-state geometries were acquired by full geometry optimization without any symmetry constraint both in the gas phase and chloroform using a polarizable continuum model (PCM) [35]. The 10 lowest singlet excited states for CaF2@FITC were calculated in chloroform within the time-dependent-DFT (TD-DFT) formalism as implemented in Gaussian [36,37]. In the case of the free FITC dianion TD-DFT calculations concerned both the 20 lowest singlet and triplet excited states (50-50). The basis set employed for all atoms was the valence triple-zeta 6-311 + G(d,p) [38,39], and all structures were input using ArgusLab 4.0 [40].

    3. RESULTS AND DISCUSSION

    The schematic energy level diagram of FITC and Er3+ in FITC-sensitized CaF2:Er3+ nanoparticles and the possible ET mechanism are presented in Fig. 1. The photocycle pathway develops through multiple steps: first, photoexcitation of dye molecules populates the singlet S1 state; subsequently, ET to the Ln3+ upper energy levels can happen directly from the excited singlet S1 state (singlet ET, SET) or from the lower lying triplet T1 state (triplet ET, TET) in turn populated through intersystem crossing (ISC) from S1. The latter event is favored by strong spin orbit coupling associated to the Ln3+ (heavy atom effect) [18,41]. Generally, energy is transferred with more efficiency to the Ln3+ upper levels that are close in energy to the dye donor state (resonance condition), but as a rule of thumb, the feeding state should be higher than the acceptor emissive level to avoid energy back transfer [30]. FITC has its lowest excited singlet state at around 19,000  cm1, which is suitable for Er3+ NIR sensitization, since the emissive level of this ion sits around 6500  cm1 and is accompanied by several superior energy states that can act as accepting levels to ensure resonance with the donor states.

    Mechanism of ET in FITC sensitized Er3+-doped CaF2 nanoparticles.

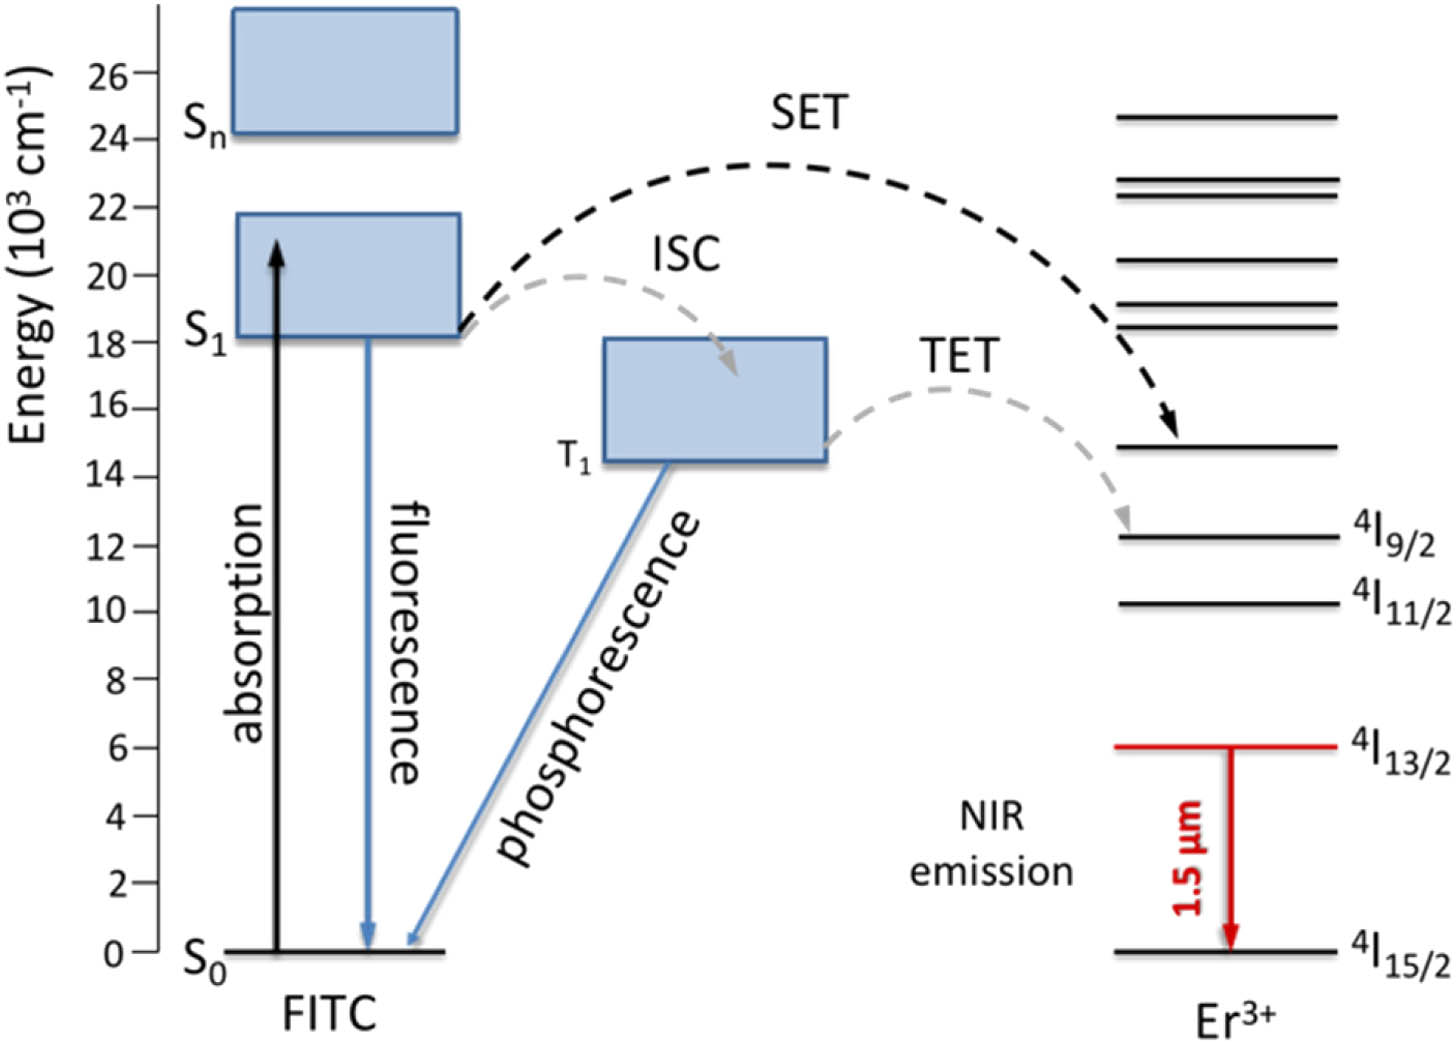
    Figure 1.Mechanism of ET in FITC sensitized Er3+-doped CaF2 nanoparticles.

    CaF2:30%Er3+ nanoparticles with an average size of 3.6 nm were synthesized according to a previously reported thermal decomposition method [29,30]. Compared to other synthetic methods, like the hydrothermal technique and the sol-gel method, the thermal decomposition method has the advantage of allowing a good control of the particle size and producing well monodispersed and crystalline nanoparticles [29,42]. A uniform distribution of spherical-like nanoparticles was obtained by taking advantage of this synthesis [(Fig. 2(a)]. The powder XRD pattern in Fig. 2(b) shows that the three main diffraction peaks at 28.2°, 46.9°, 55.7° are well matched with the standard cubic phase of CaF2 (JCPDS No. 87-0971), indicating that Er3+ doping did not significantly alter the crystal structure [43].

    (a) TEM image and (b) powder XRD pattern of CaF2:Er3+ nanoparticles.

    Figure 2.(a) TEM image and (b) powder XRD pattern of CaF2:Er3+ nanoparticles.

    The absorption and steady-state PL spectra in the Vis range of the free FITC in its dianionic form, CaF2@FITC and CaF2:Er3+@FITC in chloroform solution or dispersion with triethylamine as deprotonating agent (see Section 2), are shown in Figs. 3(a) and 3(b), respectively. The binding of FITC molecules to the surface of CaF2 nanoparticles was confirmed by the observation of the change in the shape and intensity of the absorption spectra, as well as blueshift from 538 to 536 nm for the maximum emission wavelength. As shown in Fig. 3(c), the luminescence decay dynamics of the free FITC and FITC-functionalized CaF2 sample in the Vis region follows a monoexponential trend with similar time constants of 4.7 ns (R2=0.999) and 4.3 ns (R2=0.993), respectively. Instead, the lifetime of FITC luminescence drastically decreased down to 0.95 ns (R2=0.991) after binding to the CaF2:Er3+ nanoparticles.

    (a) Absorption spectra; (b) Vis emission spectra (λex=467 nm); and (c) luminescence decay curves (λex=467 nm; λem=538 nm) of FITC (black), CaF2@FITC (blue), CaF2:Er3+@FITC (red). Steady-state spectra are normalized for the absorbed power at excitation wavelength.

    Figure 3.(a) Absorption spectra; (b) Vis emission spectra (λex=467  nm); and (c) luminescence decay curves (λex=467  nm; λem=538  nm) of FITC (black), CaF2@FITC (blue), CaF2:Er3+@FITC (red). Steady-state spectra are normalized for the absorbed power at excitation wavelength.

    The change of the steady-state optical features of FITC when combined with the CaF2 nanoparticles suggests a significant effect of the bonding on the electronic and optical properties of the dye molecule. Those phenomena can be explained by the redistribution of the electron density of the ligand upon coordination to the Ca2+ cation on the surface of the nanoparticle through the carboxylate group. A similar finding was verified in other types of dye-sensitized Ln3+-doped nanoparticles, for instance, βNaYF4:Yb3+, Er3+@IR-806 and with other dyes [17,19,44]. To better understand this phenomenon, we performed DFT calculations to highlight the differences between the FITC dianion in the free form and when coordinated to a Ca2+ ion. Figure 4(a) reports the DFT-calculated optimized geometries for the two forms. As can be seen, the FITC moiety undergoes a remarkable distortion upon coordination, which leads to a significant increase of the associated dipole moment (from 17.41 to 24.10 Debye). The calculated frontier molecular orbitals (MOs) for the two FITC forms, shown in Fig. 4(b), further support the previous hypothesis and highlight a redistribution of the electron cloud with more extended delocalization upon coordination of the dye moiety to the Ca2+ cation. Noticeably, according to time-dependent TD-DFT calculations, the dominant optical transition for the FITC dianion in the free form mainly involves the highly localized highest occupied (HOMO) and lowest unoccupied (LUMO) MOs, whereas a more mixed character, involving the more delocalized LUMO + 1 and LUMO + 2 orbitals, is associated with the lowest energy transitions of FITC coordinated to a Ca2+ ion. These findings highlight the high sensitivity of the dye dianion to the chemical environment and may account for the significant changes in the spectral shapes and intensities of both the absorption and PL spectra.

    (a) Optimized geometries and (b) MOs calculated by DFT methods at B3LYP/6-311 + G(d,p) level of theory (color codes: Ca, green; C, gray; O, red; N, purple; S, yellow; H, white). The orbitals are reported with a contour value of 0.050.

    Figure 4.(a) Optimized geometries and (b) MOs calculated by DFT methods at B3LYP/6-311 + G(d,p) level of theory (color codes: Ca, green; C, gray; O, red; N, purple; S, yellow; H, white). The orbitals are reported with a contour value of 0.050.

    On the other hand, as previously mentioned, the change of the electronic properties of the dye moiety upon coordination, while leading to a significant variation of the molecular dipole moment, does not lead to a noticeable variation of the overall oscillator strength f of the main transitions. Under the assumption that the transition giving rise to radiative emission shares the same character of the corresponding lowest energy absorption band (implying a consistent MO mixing for the Ca2+ coordinated FITC), it is not surprising that similar emission lifetimes were observed for FITC in the free form and bonded to CaF2 nanoparticles. However, as previously mentioned, the decay dynamics becomes considerably faster as Er3+ ions are doped into the nanoparticles, indicating that an additional deactivation channel, likely through ET to the Ln3+, is established in this case. The sensitization efficiency from the donor FITC to the acceptor Ln3+ can be estimated by the simplified Eq. (1) [45], ηsens=1τLn/τdye,where τLn and τdye are the total decay rate of the dye in the presence and in the absence of the Ln3+. Therefore, the calculated ηdyeLn is approximately 78%. The dyeEr3+ET process analyzed by TA spectroscopy at the ultrafast time scale will be discussed in more detail later.

    The highly efficient ET from FITC to Er3+ resulted in around 28-fold enhancement of Er3+ NIR emission with respect to bare CaF2:Er3+ at 1.5 μm corresponding to the intrashell ffI13/24I15/24 transition [Fig. 5(a)]. This provides the direct evidence that the dyeEr3+ET works well in CaF2:Er3+@FITC nanoparticles. The luminescence lifetimes at 1530 nm of CaF2:Er3+ and CaF2:Er3+@FITC, obtained from a double-exponential fitting [Fig. 5(b)], are 5.7 μs (τ1=10.5  μs, A1=0.45; τ2=1.6  μs, A2=0.63; R2=0.997; τ=A1τ1+A2τ2A1+A2=5.7  μs), and 13.4 μs (τ1=0.9  μs, A1=0.17; τ2=16.0  μs, A2=0.80; R2=0.991; τ=A1τ1+A2τ2A1+A2=13.4  μs), respectively. After FITC sensitization, the lifetime of Er3+ NIR emission increased by 2.3 times. This behavior could be attributed to a beneficial shielding effect of the dye on environmental vibrational quenching from solvent molecules [46]. The Er3+ intrinsic quantum yield ΦEr can be estimated from the ratio between the observed and the “natural” radiative lifetime of Er3+ (τrad), that is, the lifetime that the emitter would have in that specific environment in the absence of quenching phenomena. τrad=7.8(±0.7)  ms was determined from absorption spectra through the Strickler–Berg equation [47]. Therefore, ΦEr=τ/τrad can be estimated to be 0.2% and 0.1%, for CaF2:Er3+@FITC and CaF2:Er3+, respectively.

    (a) NIR emission spectra of CaF2:Er3+ (black, λex=378 nm corresponding to the Er3+4G11/2←4I15/2 transition) and CaF2:Er3+@FITC (red, λex=467 nm corresponding to the maximum of the FITC dye absorption); (b) luminescence decay curves of CaF2:Er3+ (black, λex=378 nm; λem=1530 nm) and CaF2:Er3+@FITC (red, λex=467 nm; λem=1530 nm). Steady-state spectra are normalized for the absorbed power at excitation wavelength.

    Figure 5.(a) NIR emission spectra of CaF2:Er3+ (black, λex=378  nm corresponding to the Er3+4G11/24I15/2 transition) and CaF2:Er3+@FITC (red, λex=467  nm corresponding to the maximum of the FITC dye absorption); (b) luminescence decay curves of CaF2:Er3+ (black, λex=378  nm; λem=1530  nm) and CaF2:Er3+@FITC (red, λex=467  nm; λem=1530  nm). Steady-state spectra are normalized for the absorbed power at excitation wavelength.

    TA spectroscopy measurements have been carried out to analyze the excited state evolution of the dye molecules, which can shed light on the ET pathways of dye-sensitized lanthanide (Ln)-doped fluoride luminescent nanoparticles. Both radiative and nonradiative channels can be unravelled from TA maps by probing the differential absorbance ΔA=AtA0 at a delay time (t) of the probe pulse (At) with respect to the excitation pump at t=0(A0) [48]. Samples were optically pumped at 500 nm corresponding to the lowest absorption band of FITC, either in the free form or combined to the nanoparticles. As seen from Fig. 6(b), showing the two-dimensional (2D) TA map of CaF2@FITC as reference sample, and Figs. 6(a) and 6(c), the three samples FITC, CaF2@FITC, and CaF2:Er3+@FITC, all showed similar characteristic traces in the 400–750 nm range. The TA spectra extracted at different time delays in Fig. 6(d) evidence strong negative signals involving three recognizable contributions: ground-state bleaching (GSB) bands at around 475 and 506 nm and a stimulated emission (SE) band, appearing as a weak shoulder around 540 nm. These attributions are in agreement with the shape and position of the absorption and steady-state PL emission spectra. There is also a positive signal below 450 nm that can be attributed to excited state absorption (ESA) to upper energy levels Sn (Fig. 1). The TA spectra of the free FITC display a blueshift [Figs. 6(a) and 6(b)] of the relevant features dominated by a strong negative signal in the 400–650 nm region due to GSB and SE contributions, in agreement with the absorption [(Fig. 3(a)] and PL [Fig. 3(b)] spectra.

    Two-dimensional (2D) TA (ΔA) map of (a) FITC; (b) CaF2@FITC; and (c) CaF2:Er3+@FITC in chloroform as a function of wavelength and time, upon photoexcitation at 500 nm; (d) representative selection of TA spectra of CaF2:Er3+@FITC in chloroform at different time delays, the black and gray dashed lines show the inverted PL spectrum and ground-state absorption spectrum, respectively; (e) selection of TA spectra of FITC, CaF2@FITC, and CaF2:Er3+@FITC in chloroform at 7.5 ps time delay; (f) selected kinetics of FITC, CaF2@FITC, and CaF2:Er3+@FITC for the SE signal at 550 nm in the sub-nanosecond time range.

    Figure 6.Two-dimensional (2D) TA (ΔA) map of (a) FITC; (b) CaF2@FITC; and (c) CaF2:Er3+@FITC in chloroform as a function of wavelength and time, upon photoexcitation at 500 nm; (d) representative selection of TA spectra of CaF2:Er3+@FITC in chloroform at different time delays, the black and gray dashed lines show the inverted PL spectrum and ground-state absorption spectrum, respectively; (e) selection of TA spectra of FITC, CaF2@FITC, and CaF2:Er3+@FITC in chloroform at 7.5 ps time delay; (f) selected kinetics of FITC, CaF2@FITC, and CaF2:Er3+@FITC for the SE signal at 550 nm in the sub-nanosecond time range.

    The intensity of the TA features reaches a maximum within 1 ps and subsequently decreases as the time delays to 120 ps, with no significant changes in the spectral shape. The nearly instant signal rising in the entire probed range indicates that the TA responses of the three samples are all dominated by the excited singlet state S1, and no signal is showing a slow and multistep activation of an excited triplet. GSB, SE, and ESA show the same temporal dynamics dominating in the 100 ps range and are reliably attributed to an S1Sn (n=0,2,3) transition. Figure 6(f) displays the decay curves for the SE signal at 550 nm of all the samples as extracted from TA data.

    The kinetic trace for the CaF2:Er3+@FITC sample can be best fitted by a double-exponential function with a long-lived component (>1  ns) and a short-lived component beyond the investigated temporal range (50 fs–1 ns). The relative contribution of the long-lived component to the total signal is comparable to the relative intensity of the steady-state dye luminescence emission intensity in the hybrid samples with respect to the free FITC [Fig. 3(b)]. This component is also comparable to the time-resolved PL lifetime profiles in Fig. 3(c). Interestingly, the signal for CaF2 nanoparticles without Ln3+ dopants also presents a double-exponential trend with an overall signal dynamics that is faster than that of the free dye (see also Fig. 6). The emergence of the short-lived signal accompanying a longer one in the presence of the CaF2 nanoparticles, either doped or undoped, can be attributed to the existence of distinct populations of donors interacting with the nanoparticle to a different degree. This could be modeled with a disordered arrangement of dyes consisting of FITC molecules directly and indirectly bonding to the surface of the nanoparticle due to multiple constraints related to electrostatic interactions (distribution of charges on the surface of the particle, intermolecular interactions, etc.) [49,50]. This point is highlighted by the significant change of the electron density of the Ca2+-coordinated FITC with respect to the free form, which points out the high sensitivity of the system to the chemical environment. This is especially relevant when considering a poor structurally defined system, such as a collection of organic dyes interacting with a nanoparticle, which is far more complex than a simple representation of a single dye unit coordinated to a single Ca2+ ion. Nonetheless, in the case of CaF2:Er3+@FITC, both the short-lived and the long-lived components are greatly shortened with respect to the undoped CaF2@FITC system, indicating that ET is effectively occurring from the dye to Er3+ at both the slow (nanosecond range) and ultrafast (picosecond range) time scales. From the above considerations on the evolution of the TA traces, it is also possible to conclude that the sensitization mechanism from the FITC dye to the Ln3+ reliably occurs through SET. In summary, the kinetic traces retrieved from TA data reveal an ultrafast ET regime that remains hidden to conventional time-resolved PL experiments. This phenomenon can be related to a population of dyes that are more significantly influenced by the presence of the nanoparticle and presumably directly anchored to its surface. The retrieved time constants for the ultrafast excited singlet decay in the subnanosecond region after the subtraction of the slow component are presented in Table 1, along with the calculated sensitization efficiencies. The ultrafast decay time constant of FITC coupled to CaF2 nanoparticles is around 200 ps, and it decreases to 15 ps in the presence of Er3+, showing nearly 92% sensitization efficiency. To better understand the relation between the ET efficiency and the molecular arrangement in terms of the spatial separation of the donor and acceptor, we have implemented the Förster’s model of resonance ET on the basis of experimental data. In the model, the rate for a donor–acceptor ET κFITCEr=1/τFITCEr depends on temporal, spectral, and spatial parameters as described by the following Eq. (2) [51]: κFITCEr=1τFITC9κj2128π5n4RFITCErJ=1τFITC(R0RFCEr)6,where RFITCEr is the donor–acceptor distance; R0 is the Förster radius, the distance at which the ET efficiency reaches 50%; τFITC is the decay time of the donor FITC in the absence of the acceptor Er3+;n is the refractive index of the medium (taken as 1.4459 for chloroform); κj2 is the dipole orientation factor, which is determined by the relative orientation between the transition dipole moments of the donor and the jth acceptor (here 2/3 is taken for an averaged orientation). J is the spectral overlap integral between the donor FITC emission and the acceptor Er3+ absorption, which can be expressed by the following Eq. (3) [51]: J=FFITC(λ)σEr(λ)λ4dλ,where FFITC(λ) represents the FITC emission spectral density normalized to unity (nm1), and σEr(λ) is the absorption cross section of Er3+ (nm2), as shown in Fig. 7(a). The calculated spectral overlap J and the Förster’s radius R0 are 4.8×10³  nm6 and 0.74 nm, respectively. On the basis of Eqs. (1) and (2), the dependence of the sensitization efficiency from the donor–acceptor distance R can be predicted, as shown by the plot in Fig. 7(b). As seen from Fig. 7(b), the curve presents a plateau at values almost close to unity as the donor–acceptor distance is below 0.4  nm, and it drops dramatically when the distance is beyond this range. The experimental sensitization efficiency around 92% retrieved from the TA kinetic data shown in Table 1 corresponds to donor–acceptor distances in the range 0.45–0.50 nm. These values are compatible with the spatial separation of the DFT-calculated transition dipole moment vector for the optimized geometry of the FITC molecules upon bonding, as depicted in the inset of Fig. 7(b). Therefore, the exceptional dye-to-Er3+ sensitization efficiency at the ultrafast time scale in the CaF2:Er3+@FITC nanoparticles is consistent with the small size and the particular geometrical construction of FITC molecules attached to the surface of the CaF2:Er3+ nanoparticle. Instead, the “slow” ET occurring at the nanosecond time scale could be associated with dye molecules that are not optimally arranged on the surface of the particle (not directly bonded or distorted). These results highlight that small variations of the donor–acceptor distances in the subnanometer range can dramatically affect the sensitization efficiency in dye-sensitized erbium-doped nanoparticles.

    FITC-Excited Singlet Ultrafast Decay Time Constants and FITC to Er3+ Sensitization Efficiency Calculated through Eq. (1)

    Sampleτ (ps)ηsens (%)
    FITC
    CaF2200 (10)
    Er3+15 (2)92

    (a) Spectral overlap of Er3+ absorption cross section (red) and FITC fluorescence spectrum normalized to unity (black curve with shaded area). (b) FITC to Er3+ sensitization efficiency (ηsens) calculated by the Förster’s model as a function of the donor–acceptor distance (R). Inset, DFT-calculated optimized geometry for FITC coordinated to Ca2+ where the light blue arrow represents the TD-DFT calculated S1−S0 transition dipole moment.

    Figure 7.(a) Spectral overlap of Er3+ absorption cross section (red) and FITC fluorescence spectrum normalized to unity (black curve with shaded area). (b) FITC to Er3+ sensitization efficiency (ηsens) calculated by the Förster’s model as a function of the donor–acceptor distance (R). Inset, DFT-calculated optimized geometry for FITC coordinated to Ca2+ where the light blue arrow represents the TD-DFT calculated S1S0 transition dipole moment.

    The overall ET efficiency from the two populations of dyes in the “optimal” and “distorted” geometry can be estimated by considering the ratio of the fast and slow decay components in the TA decay trace of the reference CaF2@FITC. It can be estimated that 85% of the dye molecules give rise to ET to Er3+ with 92% efficiency, whereas the remaining population of excited molecules transfer energy with 78% efficiency, as calculated from time-resolved PL experiments. This estimation yields an overall sensitization efficiency of over 89% (0.85×92%+0.15×78%=89.9%), which is much higher than those previously reported for dye-sensitized Ln3+ luminescence nanoparticles [17,45,52].

    4. CONCLUSIONS

    In conclusion, we have provided the first in-depth study of the structural, electronic, and photophysical properties of dye-sensitized Er3+ nanoparticles and highlighted the key factors that regulate the emission efficiency in the NIR. We have shown that the FITC dye molecules undergo significant changes of the structure and electronic distribution when binding to a nanoparticle, which dramatically influences their optical properties. By a unique combination of conventional PL and TA spectroscopy, we were able to unravel the detailed mechanism of ET at the organic–inorganic interface. Sensitization occurs directly through the dye singlet state in different time regimes, at the nanosecond and at the picosecond time scales, indicating that different populations of dyes, differently arranged around the nanoparticle, contribute to the ET process. The combination of a rational design of the nanoparticle, whose dimensionality is kept below 3.6 nm, and the distortion of the FITC moiety, which implies a sub-0.5 nm spatial separation of its transition dipole moment from the surface of the nanoparticle, leads to a distance between the energy donors (FITC dyes) and acceptors (Er3+ ions) well below the Förster’s radius (0.74 nm). This results in an exceptional sensitization efficiency of the FITC dye to Er3+ reaching up to over 89% and a 28-fold increase of the emission intensity at 1.5 μm with respect to bare doped nanoparticles.

    These results highlight that, to achieve highly efficient ET in dye-sensitized Ln-doped nanoparticles, dye molecules must be reasonably designed to have suitable excited singlet energy states and localized MOs (transition dipole moments) close to the surface of the nanoparticle. This proof of concept of dye-sensitized Er3+ NIR emission can promote new opportunities for a superior improvement of optical fiber amplifiers and other photonic technologies working at 1.5 μm.

    Acknowledgment

    Acknowledgment. We acknowledge critical and quantity of testing work supported by Beijing Zhongkebaice Technology Service Co., Ltd.

    References

    [1] J. Liu, A. M. Kaczmarek, R. V. Deun. Advances in tailoring luminescent rare-earth mixed inorganic materials. Chem. Soc. Rev., 47, 7225-7238(2018).

    [2] J.-C. G. Bünzli, C. Piguet. Taking advantage of luminescent lanthanide ions. Chem. Soc. Rev., 34, 1048-1077(2005).

    [3] F. Artizzu, F. Quochi, L. Marchiò, C. Figus, D. Loche, M. Atzori, V. Sarritzu, A. M. Kaczmarek, R. V. Deun, M. Saba, A. Serpe, A. Mura, M. L. Mercuri, G. Bongiovanni, P. Deplano. Light conversion control in NIR-emissive optical materials based on heterolanthanide ErxYb3–x quinolinolato molecular components. Chem. Mater., 27, 4082-4092(2015).

    [4] S. L. Zuo, P. Chen, C. F. Pan. Mechanism of magnetic field-modulated luminescence from lanthanide ions in inorganic crystal: a review. Rare Met., 39, 1113-1126(2020).

    [5] D. Tu, L. Liu, Q. Ju, Y. Liu, H. Zhu, R. Li, X. Chen. Time-resolved FRET biosensor based on amine-functionalized lanthanide-doped NaYF4 nanocrystals. Angew. Chem., 50, 6306-6310(2011).

    [6] J. Liu, A. M. Kaczmarek, F. Artizzu, R. V. Deun. Ultraefficient cascade energy transfer in dye-sensitized core/shell fluoride nanoparticles. ACS Photon., 6, 659-666(2019).

    [7] J. B. Zhao, L. L. Wu. Yb3+- and Er3+-doped Y2O3 microcrystals for upconversion photoluminescence and energy transfer with enhancements of near-ultraviolet emission. Rare Met., 40, 123-127(2021).

    [8] J.-C. G. Bünzli, A.-S. Chauvin. Lanthanides in Solar Energy Conversion(2014).

    [9] T. Kitagawa, K. Hattori, K. Shuto, M. Yasu, M. Kobayashi, M. Horiguchi. Amplification in erbium-doped silica-based planar lightwave circuits. Electron. Lett., 28, 1818-1819(1992).

    [10] Y. C. Yan, A. J. Faber, H. De Waal, A. P. Polman, G. Kik. Erbium-doped phosphate glass waveguide on silicon with 4.1  dB/cm gain at 1.535  μm. Appl. Phys. Lett., 71, 2922-2924(1997).

    [11] W. You, Y. Huang, Y. Chen, Y. Lin, Z. Luo. The Yb3+ to Er3+ energy transfer in YAl3(BO3)4 crystal. Opt. Commun., 281, 4936-4939(2008).

    [12] J. Zhou, D. Jin. Triplet state brightens upconversion. Nat. Photonics, 12, 378-379(2018).

    [13] X. Wang, R. R. Valiev, T. Y. Ohulchanskyy, H. Ågren, C. Yang, G. Chen. Dye-sensitized lanthanide-doped upconversion nanoparticles. Chem. Soc. Rev., 46, 4150-4167(2017).

    [14] Q. Liu, X. Zou, Y. Shi, B. Shen, C. Cao, S. Cheng, W. Feng, F. Li. An efficient dye-sensitized NIR emissive lanthanide nanomaterial and its application in fluorescence-guided peritumoral lymph node dissection. Nanoscale, 10, 12573-12581(2018).

    [15] D. Mara, F. Artizzu, P. F. Smet, A. M. Kaczmarek, K. V. Hecke, R. V. Deun. Vibrational quenching in near-infrared emitting lanthanide complexes: a quantitative experimental study and novel insights. Chem. Eur. J., 25, 15944-15956(2019).

    [16] J. Zhang, C. M. Shade, D. A. Chengelis, S. Petoud. A strategy to protect and sensitize near-infrared luminescent Nd3+ and Yb3+: organic tropolonate ligands for the sensitization of Ln3+-doped NaYF4 nanocrystals. J. Am. Chem. Soc., 129, 14834-14835(2007).

    [17] B. Xue, D. Wang, L. Tu, D. Sun, P. Jing, Y. Chang, Y. Zhang, X. Liu, J. Zuo, J. Song, J. Qu, E. J. Meijer, H. Zhang, X. Kong. Ultrastrong absorption meets ultraweak absorption: unraveling the energy-dissipative routes for dye-sensitized upconversion luminescence. J. Phys. Chem. Lett., 9, 4625-4631(2018).

    [18] D. J. Garfield, N. J. Borys, S. M. Hamed, N. A. Torquato, C. A. Tajon, B. Tian, B. Shevitski, E. S. Barnard, Y. D. Suh, S. Aloni, J. B. Neaton, E. M. Chan, B. E. Cohen, P. J. Schuck. Enrichment of molecular antenna triplets amplifies upconverting nanoparticle emission. Nat. Photonics, 12, 402-407(2018).

    [19] Z. Wang, A. Meijerink. Dye-sensitized downconversion. J. Phys. Chem. Lett., 9, 1522-1526(2018).

    [20] L. Yuan, W. Lin, K. Zheng, L. He, W. Huang. Far-red to near infrared analyte-responsive fluorescent probes based on organic fluorophore platforms for fluorescence imaging. Chem. Soc. Rev., 42, 622-661(2013).

    [21] T. Y. Lin, Z. J. Lian, C. X. Yao, X. Y. Sun, X. Y. Liu, Z. Y. Yan, S. M. Wu. CdSe quantum dots labeled Staphylococcus aureus for research studies of THP-1 derived macrophage phagocytic behavior. RSC Adv., 10, 260-270(2020).

    [22] L. W. Runnels, S. F. Scarlata. Theory and application of fluorescence homotransfer to melittin oligomerization. Biophys. J., 69, 1569-1583(1995).

    [23] R. G. McClelland, A. C. Pinder. Detection of Salmonella typhimurium in dairy products with flow cytometry and monoclonal antibodies. Appl. Environ. Microbiol., 60, 4255-4262(1994).

    [24] P. Huang, W. Zheng, S. Zhou, D. Tu, Z. Chen, H. Zhu, R. Li, E. Ma, M. Huang, X. Chen. Lanthanide-doped LiLuF4 upconversion nanoprobes for the detection of disease biomarkers. Angew. Chem., 126, 1276-1281(2014).

    [25] Z. Li, Y. Zhang, L. Huang, Y. Yang, Y. Zhao, G. El-Banna, G. Han. Nanoscale ‘fluorescent stone’: luminescent calcium fluoride nanoparticles as theranostic platforms. Theranostics, 6, 2380-2393(2016).

    [26] B. Xu, D. Li, Z. Huang, C. Tang, W. Mo, Y. Ma. Alleviating luminescence concentration quenching in lanthanide doped CaF2 based nanoparticles through Na+ ion doping. Dalton Trans., 47, 7534-7540(2018).

    [27] W. Yin, G. Tian, W. Ren, L. Yan, S. Jin, Z. Gu, L. Zhou, J. Li, Y. Zhao. Design of multifunctional alkali ion doped CaF2 upconversion nanoparticles for simultaneous bioimaging and therapy. Dalton Trans., 43, 3861-3870(2014).

    [28] S. Wen, J. Zhou, P. J. Schuck, Y. D. Suh, T. W. Schmidt, D. Jin. Future and challenges for hybrid upconversion nanosystems. Nat. Photonics, 13, 828-838(2019).

    [29] J. C. Boyer, F. Vetrone, L. A. Cuccia, J. A. Capobianco. Synthesis of colloidal upconverting NaYF4 nanocrystals doped with Er3+, Yb3+ and Tm3+, Yb3+ via thermal decomposition of lanthanide trifluoroacetate precursors. J. Am. Chem. Soc., 128, 7444-7445(2006).

    [30] B. Xu, H. He, Z. Gu, S. Jin, Y. Ma, T. Zhai. Improving 800  nm triggered upconversion emission for lanthanide-doped CaF2 nanoparticles through sodium ion doping. J. Phys. Chem. C, 121, 18280-18287(2017).

    [31] R. G. Parr, W. Yang. Density Functional Theory of Atoms and Molecules(1989).

    [32] A. D. Becke. Density-functional thermochemistry. III. The role of exact exchange. J. Chem. Phys., 98, 5648-5652(1993).

    [33] C. Lee, W. Yang, R. G. Parr. Development of the Colle–Salvetti correlation-energy formula into a functional of the electron density. Phys. Rev. B, 37, 785-789(1988).

    [34] M. J. Frisch, G. W. Trucks, H. B. Schlegel, G. E. Scuseria, M. A. Robb, J. R. Cheeseman, G. Scalmani, V. Barone, G. A. Petersson, H. Nakatsuji, X. Li, M. Caricato, A. V. Marenich, J. Bloino, B. G. Janesko, R. Gomperts, B. Mennucci, H. P. Hratchian, J. V. Ortiz, A. F. Izmaylov, J. L. Sonnenberg, D. Williams-Young, F. Ding, F. Lipparini, F. Egidi, J. Goings, B. Peng, A. Petrone, T. Henderson, D. Ranasinghe, V. G. Zakrzewski, J. Gao, N. Rega, G. Zheng, W. Liang, M. Hada, M. Ehara, K. Toyota, R. Fukuda, J. Hasegawa, M. Ishida, T. Nakajima, Y. Honda, O. Kitao, H. Nakai, T. Vreven, K. Throssell, J. A. J. Montgomery, J. E. Peralta, F. Ogliaro, M. J. Bearpark, J. J. Heyd, E. N. Brothers, K. N. Kudin, V. N. Staroverov, T. A. Keith, R. Kobayashi, J. Normand, K. Raghavachari, A. P. Rendell, J. C. Burant, S. S. Iyengar, J. Tomasi, M. Cossi, J. M. Millam, M. Klene, C. Adamo, R. Cammi, J. W. Ochterski, R. L. Martin, K. Morokuma, O. Farkas, J. B. Foresman, D. J. Fox. Gaussian 16 Rev. C.01(2016).

    [35] M. Cossi, N. Rega, G. Scalmani, V. Barone. Energies, structures, and electronic properties of molecules in solution with the C-PCM solvation model. J. Comp. Chem., 24, 669-681(2003).

    [36] M. E. Casida, C. Jamorski, K. C. Casida, D. R. Salahub. Molecular excitation energies to high-lying bound states from time-dependent density-functional response theory: characterization and correction of the time-dependent local density approximation ionization threshold. J. Chem. Phys., 108, 4439-4449(1998).

    [37] R. E. Stratmann, G. E. Scuseria, M. J. Frisch. An efficient implementation of time-dependent density-functional theory for the calculation of excitation energies of large molecules. J. Chem. Phys., 109, 8218-8224(1998).

    [38] A. D. McLean, G. S. Chandler. Contracted Gaussian basis sets for molecular calculations. I. Second row atoms, Z=11–18. J. Chem. Phys., 72, 5639-5648(1980).

    [39] R. Krishnan, J. S. Binkley, R. Seeger, J. A. Pople. Self-consistent molecular orbital methods. XX. A basis set for correlated wave functions. J. Chem. Phys., 72, 650-654(1980).

    [40] M. A. Thompson. ArgusLab 4.0.1, Planaria Software LLC: Seattle, WA.

    [41] C. Du, H. Wang, F. Yang, P. C. Hammel. Systematic variation of spin-orbit coupling with d-orbital filling: large inverse spin Hall effect in 3D transition metals. Phys. Rev. B, 90, 140407(2014).

    [42] M. He, P. Huang, C. Zhang, F. Chen, C. Wang, J. Ma, R. He, D. Cui. A general strategy for the synthesis of upconversion rare earth fluoride nanocrystals via a novel OA/ionic liquid two-phase system. Chem. Commun., 47, 9510-9512(2011).

    [43] M. Verziu, M. Serano, B. Jurca, V. I. Parvulescu, S. M. Coman, G. Scholz, E. Kemnitz. Catalytic features of Nb-based nanoscopic inorganic fluorides for an efficient one-pot conversion of cellulose to lactic acid. Catal. Today, 306, 102-110(2018).

    [44] W. Zou, C. Visser, J. A. Maduro, M. S. Pshenichnikov, J. C. Hummelen. Broadband dye-sensitized upconversion of near-infrared light. Nat. Photonics, 6, 560-564(2012).

    [45] W. Shao, C. K. Lim, Q. Li, M. T. Swihart, P. N. Prasad. Dramatic enhancement of quantum cutting in lanthanide-doped nanocrystals photosensitized with an aggregation-induced enhanced emission dye. Nano Lett., 18, 4922-4926(2018).

    [46] J. J. Nogueira, M. Oppel, L. González. Enhancing intersystem crossing in phenotiazinium dyes by intercalation into DNA. Angew. Chem., 54, 4375-4378(2015).

    [47] S. J. Strickler, R. A. Berg. Relationship between absorption intensity and fluorescence lifetime of molecules. J. Chem. Phys., 37, 814-822(1962).

    [48] P. Geiregat, J. Maes, K. Chen, E. Drijvers, J. De Roo, J. M. Hodgkiss, Z. Hens. Using bulk-like nanocrystals to probe intrinsic optical gain characteristics of inorganic lead halide perovskites. ACS Nano, 12, 10178-10188(2018).

    [49] W. R. Browne, J. G. Vos. The effect of deuteriation on the emission lifetime of inorganic compounds. Coord. Chem. Rev., 219, 761-787(2001).

    [50] J. Liu, P. Geiregat, L. Pilia, R. Van Deun, F. Artizzu. Molecular size matters: ultrafast dye singlet sensitization pathways to bright nanoparticle emission. Adv. Opt. Mater., 9, 2001678(2021).

    [51] T. Förster. 10th Spiers memorial lecture. Transfer mechanisms of electronic excitation. Discuss. Faraday Soc., 27, 7-17(1959).

    [52] W. Wei, G. Chen, A. Baev, G. S. He, W. Shao, J. Damasco, P. N. Prasad. Alleviating luminescence concentration quenching in upconversion nanoparticles through organic dye sensitization. J. Am. Chem. Soc., 138, 15130-15133(2016).

    Jing Liu, Flavia Artizzu, Min Zeng, Luca Pilia, Pieter Geiregat, Rik Van Deun. Dye-sensitized Er3+-doped CaF2 nanoparticles for enhanced near-infrared emission at 1.5 μm[J]. Photonics Research, 2021, 9(10): 2037
    Download Citation