Author Affiliations
College of Big Data and Information Engineering, Guizhou University, Guiyang, Guizhou 550025, Chinashow less
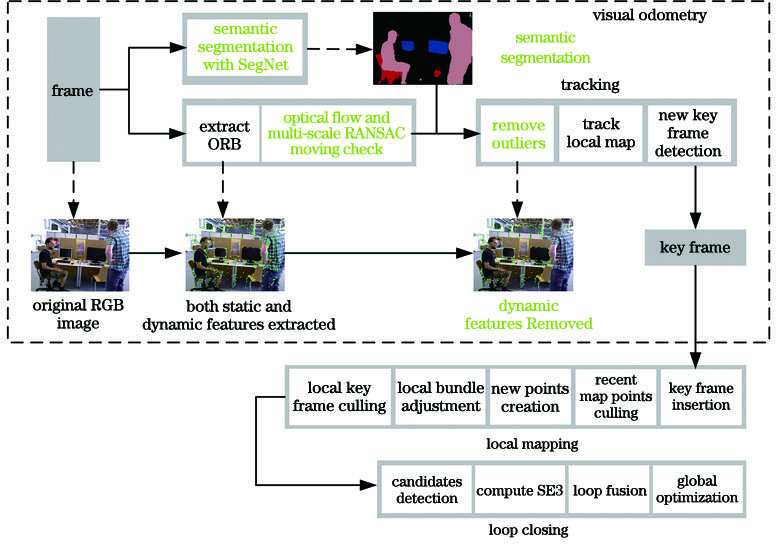
Fig. 1. System structure of proposed visual odometry
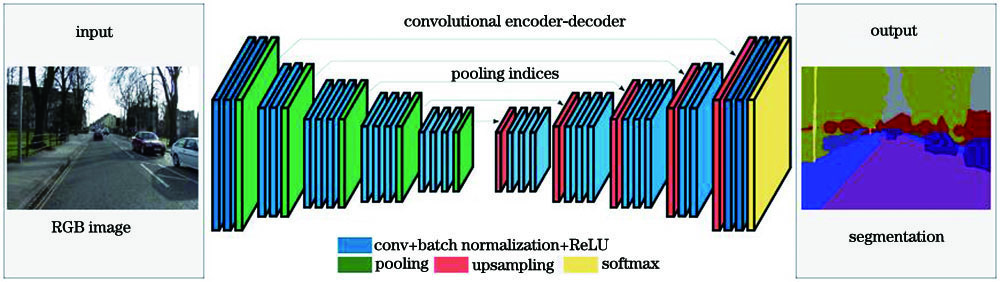
Fig. 2. Network architecture of SegNet
Fig. 3. Results of semantic segmentation. (a) Original image; (b) segmentation result
Fig. 4. RANSAC effect comparison under different scales. (a) Scale is 1 and 0.3, number of inliers is 238; (b) scale is 1 and 0.2, number of inliers is 210; (c) scale is 1 and 0.1, number of inliers is 159; (d) scale is 0.1, number of inliers is 168
Fig. 5. Epipolar geometric constraints. (a) p2 is on the polar line L2; (b) p2 is not strictly on the polar line L2
Fig. 6. Outliers removing. (a) All feature points are extracted; (b) outliers lie on people are removed
Fig. 7. Comparison of ATE. (a) ORB-SLAM2; (b) proposed scheme
Fig. 8. Comparison of relative translation error. (a) ORB-SLAM2; (b) proposed scheme
| Sequency | ORB-SLAM2 /m | Proposed /m | Improvement /% |
|---|
| RMSE | Mean | Median | S.D. | RMSE | Mean | Median | S.D. | RMSE | Mean | Median | S.D. |
|---|
| wX | 0.565505 | 0.528696 | 0.515921 | 0.200691 | 0.019148 | 0.015891 | 0.013613 | 0.010682 | 96.61 | 96.99 | 97.36 | 94.68 | | wH | 0.327989 | 0.275986 | 0.232572 | 0.177225 | 0.028845 | 0.024179 | 0.020507 | 0.015730 | 91.21 | 91.24 | 91.18 | 91.12 | | wR | 0.817879 | 0.695593 | 0.642242 | 0.430206 | 0.407781 | 0.352362 | 0.270319 | 0.205247 | 50.14 | 49.34 | 57.91 | 52.29 | | wS | 0.409268 | 0.369913 | 0.293660 | 0.175114 | 0.007302 | 0.006431 | 0.006031 | 0.003459 | 98.22 | 98.26 | 97.95 | 98.02 | | sX | 0.009275 | 0.007939 | 0.007251 | 0.004796 | 0.009962 | 0.008540 | 0.007845 | 0.005129 | -7.41 | -7.57 | -8.19 | -6.94 | | sH | 0.027882 | 0.024288 | 0.022784 | 0.013692 | 0.014589 | 0.012853 | 0.011611 | 0.006902 | 47.68 | 47.08 | 49.04 | 49.59 | | sR | 0.021513 | 0.016177 | 0.011756 | 0.014181 | 0.016531 | 0.012956 | 0.009905 | 0.010268 | 23.16 | 19.91 | 15.75 | 27.59 | | sS | 0.007698 | 0.006775 | 0.006045 | 0.003655 | 0.006142 | 0.005233 | 0.004683 | 0.003216 | 20.21 | 22.76 | 22.53 | 12.01 |
|
Table 1. Typical value of ATE
| Sequency | ORB-SLAM2 /m | Proposed /m | Improvement /% |
|---|
| RMSE | Mean | Median | S.D. | RMSE | Mean | Median | S.D. | RMSE | Mean | Median | S.D. |
|---|
| wX | 0.825981 | 0.692976 | 0.648657 | 0.449478 | 0.028086 | 0.023557 | 0.020073 | 0.015293 | 96.60 | 96.60 | 96.91 | 96.60 | | wH | 0.502363 | 0.403237 | 0.436454 | 0.299615 | 0.040362 | 0.035091 | 0.032131 | 0.019942 | 91.97 | 91.30 | 92.64 | 93.34 | | wR | 1.212279 | 1.006164 | 0.943469 | 0.676205 | 0.138982 | 0.087917 | 0.042314 | 0.102784 | 88.54 | 91.26 | 95.52 | 84.80 | | wS | 0.585281 | 0.403727 | 0.157596 | 0.423743 | 0.010569 | 0.009465 | 0.008933 | 0.004703 | 98.19 | 97.66 | 94.33 | 98.89 | | sX | 0.013602 | 0.011845 | 0.010865 | 0.006688 | 0.014602 | 0.012807 | 0.011729 | 0.007015 | -7.35 | -8.12 | -7.95 | -4.89 | | sH | 0.040732 | 0.033476 | 0.028965 | 0.023205 | 0.020813 | 0.018533 | 0.016983 | 0.009471 | 48.90 | 44.64 | 41.37 | 59.19 | | sR | 0.030898 | 0.025071 | 0.020812 | 0.018059 | 0.024480 | 0.020617 | 0.017343 | 0.013200 | 20.77 | 17.77 | 16.67 | 26.91 | | sS | 0.012007 | 0.010637 | 0.009772 | 0.005570 | 0.009133 | 0.008002 | 0.007147 | 0.004403 | 23.94 | 24.77 | 26.86 | 20.95 |
|
Table 2. Typical value of relative translation error
| Sequency | ORB-SLAM2 /(°) | Proposed /(°) | Improvement /% |
|---|
| RMSE | Mean | Median | S.D. | RMSE | Mean | Median | S.D. | RMSE | Mean | Median | S.D. |
|---|
| wX | 14.812930 | 12.411189 | 11.075135 | 8.086117 | 0.717936 | 0.554291 | 0.449855 | 0.456282 | 95.15 | 95.53 | 95.94 | 94.36 | | wH | 13.379170 | 11.226538 | 14.220488 | 7.277847 | 0.930220 | 0.806664 | 0.727123 | 0.463252 | 93.05 | 92.81 | 94.89 | 93.63 | | wR | 22.021472 | 17.877791 | 16.175450 | 12.858064 | 2.780387 | 1.798397 | 0.922173 | 2.013343 | 87.37 | 89.94 | 94.30 | 84.34 | | wS | 10.334787 | 7.085263 | 1.830560 | 7.523754 | 0.286392 | 0.257924 | 0.242004 | 0.124482 | 97.23 | 96.36 | 86.78 | 98.35 | | sX | 0.578052 | 0.494635 | 0.422254 | 0.299133 | 0.590790 | 0.509834 | 0.442760 | 0.298500 | -2.20 | -3.07 | -4.86 | 0.21 | | sH | 1.030726 | 0.924055 | 0.857998 | 0.456638 | 0.716727 | 0.644671 | 0.600926 | 0.313205 | 30.46 | 30.23 | 29.96 | 31.41 | | sR | 0.882169 | 0.767921 | 0.700110 | 0.434188 | 0.755252 | 0.670573 | 0.623672 | 0.347473 | 14.39 | 12.68 | 10.92 | 19.97 | | sS | 0.336292 | 0.303505 | 0.286266 | 0.144834 | 0.316251 | 0.283073 | 0.264374 | 0.141012 | 5.96 | 6.73 | 7.65 | 2.64 |
|
Table 3. Typical value of relative rotation error
| Sequency | DS-SLAM /m | Proposed /m | Improvement /% |
|---|
| RMSE | Mean | Median | S.D. | RMSE | Mean | Median | S.D. | RMSE | Mean | Median | S.D. |
|---|
| wX | 0.022180 | 0.016869 | 0.013272 | 0.014402 | 0.019148 | 0.015891 | 0.013613 | 0.010682 | 13.67 | 5.80 | -2.57 | 25.83 | | wH | 0.032083 | 0.026748 | 0.022648 | 0.017715 | 0.028845 | 0.024179 | 0.020507 | 0.015730 | 10.09 | 9.60 | 9.45 | 11.21 | | wR | 0.433820 | 0.368918 | 0.249150 | 0.228252 | 0.407781 | 0.352362 | 0.270319 | 0.205247 | 6.00 | 4.49 | -8.50 | 10.08 | | wS | 0.007709 | 0.006979 | 0.006576 | 0.003275 | 0.007302 | 0.006431 | 0.006031 | 0.003459 | 5.28 | 7.85 | 8.29 | -5.62 | | sX | 0.010339 | 0.008831 | 0.007981 | 0.005377 | 0.009962 | 0.008540 | 0.007845 | 0.005129 | 3.65 | 3.30 | 1.70 | 4.61 | | sH | 0.014816 | 0.013229 | 0.011732 | 0.006672 | 0.014589 | 0.012853 | 0.011611 | 0.006902 | 1.53 | 2.84 | 1.03 | -3.45 | | sR | 0.020242 | 0.015779 | 0.011601 | 0.012680 | 0.016531 | 0.012956 | 0.009905 | 0.010268 | 18.33 | 17.89 | 14.62 | 19.02 | | sS | 0.006142 | 0.005233 | 0.004683 | 0.003216 | 0.006273 | 0.005461 | 0.004728 | 0.003085 | -2.13 | -4.36 | -0.96 | 4.07 |
|
Table 4. Typical value of ATE
| Sequency | DS-SLAM /m | Proposed /m | Improvement /% |
|---|
| RMSE | Mean | Median | S.D. | RMSE | Mean | Median | S.D. | RMSE | Mean | Median | S.D. |
|---|
| wX | 0.032488 | 0.025585 | 0.020938 | 0.020022 | 0.028086 | 0.023557 | 0.020073 | 0.015293 | 13.55 | 7.93 | 4.13 | 23.62 | | wH | 0.045461 | 0.039412 | 0.035235 | 0.022658 | 0.040362 | 0.035091 | 0.032131 | 0.019942 | 11.22 | 10.96 | 8.81 | 11.99 | | wR | 0.148749 | 0.094158 | 0.045830 | 0.112832 | 0.138982 | 0.087917 | 0.042314 | 0.102784 | 6.57 | 6.63 | 7.67 | 8.91 | | wS | 0.010977 | 0.009989 | 0.009499 | 0.004552 | 0.010569 | 0.009465 | 0.008933 | 0.004703 | 3.72 | 5.25 | 5.96 | -3.32 | | sX | 0.014969 | 0.013095 | 0.012071 | 0.007252 | 0.014602 | 0.012807 | 0.011729 | 0.007015 | 2.45 | 2.20 | 2.83 | 3.27 | | sH | 0.021379 | 0.019180 | 0.017768 | 0.009444 | 0.020813 | 0.018533 | 0.016983 | 0.009471 | 2.65 | 3.37 | 4.42 | -0.29 | | sR | 0.028873 | 0.024268 | 0.020204 | 0.015643 | 0.024480 | 0.020617 | 0.017343 | 0.013200 | 15.21 | 15.04 | 14.16 | 15.62 | | sS | 0.009217 | 0.008144 | 0.007363 | 0.004316 | 0.009133 | 0.008002 | 0.007147 | 0.004403 | 0.91 | 1.74 | 2.93 | -2.02 |
|
Table 5. Typical value of translation
| Sequency | DS-SLAM /(°) | Proposed /(°) | Improvement /% |
|---|
| RMSE | Mean | Median | S.D. | RMSE | Mean | Median | S.D. | RMSE | Mean | Median | S.D. |
|---|
| wX | 0.768973 | 0.583035 | 0.460229 | 0.501387 | 0.717936 | 0.554291 | 0.449855 | 0.456282 | 6.64 | 4.93 | 2.25 | 9.00 | | wH | 0.983289 | 0.862411 | 0.769254 | 0.472340 | 0.930220 | 0.806664 | 0.727123 | 0.463252 | 5.40 | 6.46 | 5.48 | 1.92 | | wR | 3.013413 | 1.909141 | 0.996452 | 2.320810 | 2.780387 | 1.798397 | 0.922173 | 2.013343 | 7.73 | 5.80 | 7.45 | 13.25 | | wS | 0.285163 | 0.261389 | 0.250628 | 0.113990 | 0.286392 | 0.257924 | 0.242004 | 0.124482 | -0.43 | 1.33 | 3.44 | -9.20 | | sX | 0.577467 | 0.493059 | 0.420298 | 0.300600 | 0.590790 | 0.509834 | 0.442760 | 0.298500 | -2.31 | -3.40 | -5.34 | 0.70 | | sH | 0.778858 | 0.698167 | 0.649726 | 0.345227 | 0.716727 | 0.644671 | 0.600926 | 0.313205 | 7.98 | 7.66 | 7.51 | 9.28 | | sR | 0.863546 | 0.760713 | 0.701008 | 0.408689 | 0.755252 | 0.670573 | 0.623672 | 0.347473 | 12.54 | 11.85 | 11.03 | 14.98 | | sS | 0.308551 | 0.276659 | 0.259871 | 0.136614 | 0.316251 | 0.283073 | 0.264374 | 0.141012 | -2.50 | -2.32 | -1.73 | -3.22 |
|
Table 6. Typical value of rotation
| Sequency | DS-SLAM /ms | Proposed /ms | Reduced /% |
|---|
| wX | 0.019487 | 0.013030 | 33.14 | | wH | 0.018344 | 0.010929 | 40.42 | | wR | 0.017183 | 0.010957 | 36.23 | | wS | 0.016712 | 0.015695 | 6.09 | | sX | 0.017424 | 0.014163 | 18.72 | | sH | 0.018717 | 0.013182 | 29.58 | | sR | 0.016412 | 0.011832 | 27.90 | | sS | 0.014110 | 0.013517 | 4.20 |
|
Table 7. Time consuming of moving consistency check