
Long Zhang, Ming Zhang, Tangnan Chen, Dajian Liu, Shihan Hong, Daoxin Dai. Ultrahigh-resolution on-chip spectrometer with silicon photonic resonators[J]. Opto-Electronic Advances, 2022, 5(7): 210100
- Opto-Electronic Advances
- Vol. 5, Issue 7, 210100 (2022)
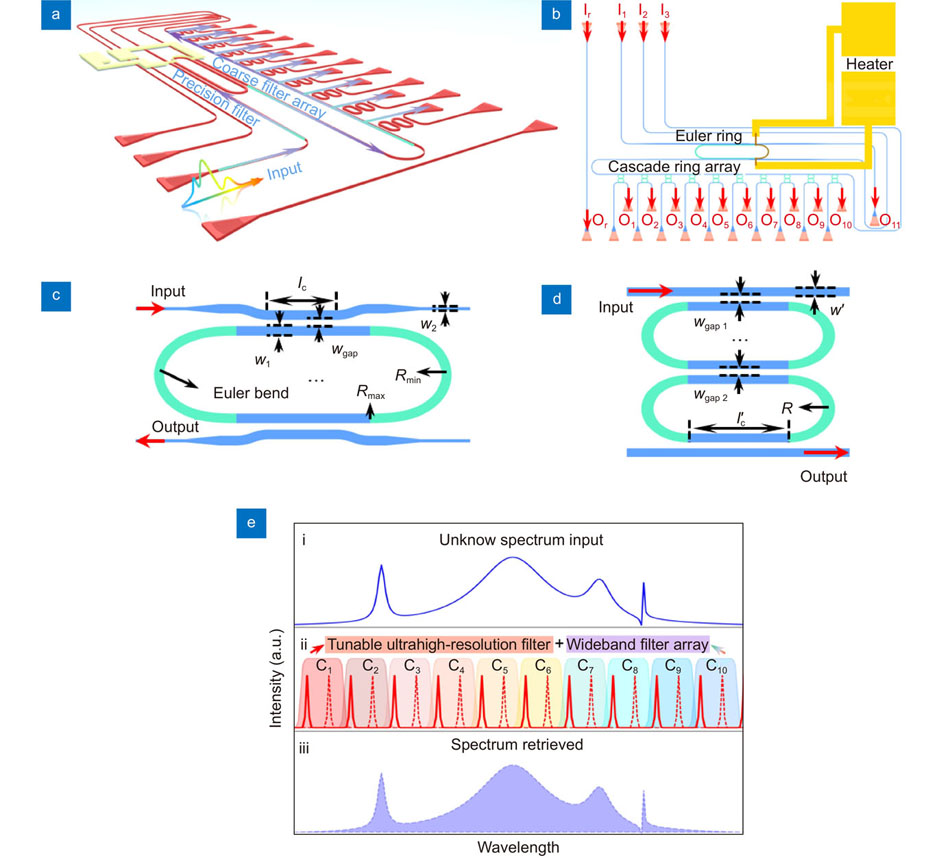
Fig. 1. The 3D view (a ) and the top view (b ) of the present ultra-high-resolution on-chip spectrometer. Schematic configurations of the ultra-high-Q resonator (c ) and the wideband resonator (d ). (e ) The principle of the spectrum retrieved process.
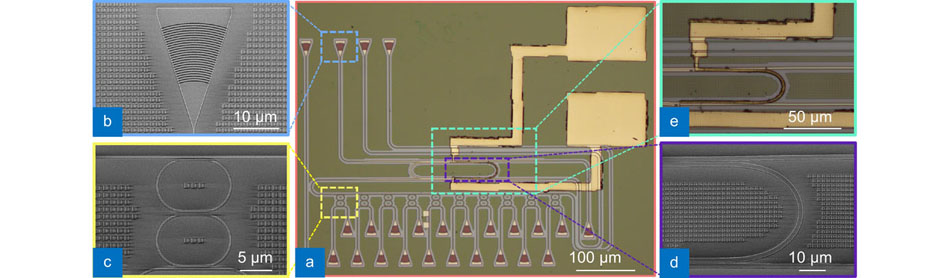
Fig. 2. (a ) Microscope images of the fabricated ultrahigh-resolution spectrometer. Zoom-in views of the grating coupler (b ), the wideband resonator (c ), the Euler bend (d ), and the heater on ultra-high-Q resonator (e ).
Fig. 3. (a ) Measured spectrum response of the fabricated 10-channel wideband resonators. (b ) Measured spectral responses at the through/drop ports of the ultrahigh-Q resonator; Inset: the resonance peak. (c ) The spectral response of the ultrahigh-Q resonator when applying different heating power. (d ) The resonance wavelength as the heating power Ph increases. (e ) The calibrated wavelength-power map. As an example, the arrow indicates the peak wavelength λi dropped by the i-th cascaded wideband resonator when the heating power Ph is 30 mW.
Fig. 4. Retrieved spectrum for a given spectrum with a single peak when using the present on-chip spectrometer as well as a commercial OSA with a resolution of 0.02 nm. (a ) The peak wavelength is 1546.61 nm locating at channel C1. (b ) The peak wavelength is 1549.45 nm locating at channel C4. (c ) The peak wavelength is 1552.67 nm locating at channel C7.
Fig. 5. Normalized retrieved spectrum with double peak input at channel C7. (a ) (1552.627, 1552.632) nm, (b ) (1552.024, 1552.624) nm, (c ) (1552.643, 1552.646) nm.
Fig. 6. Measured results for the spectrum generated from a commercial fiber Bragg filter.
|
Table 1. Comparison of some typical spectrometers reported.

Set citation alerts for the article
Please enter your email address
© Copyright 2018-2021 | Chinese Laser Press. All Rights Reserved 沪ICP备15018463号-20