1State Key Laboratory for Modern Optical Instrumentation, Center for Optical & Electromagnetic Research, College of Optical Science and Engineering, International Research Center for Advanced Photonics, Zhejiang University, Zijingang Campus, Hangzhou 310058, China
2Ningbo Research Institute, Zhejiang University, Ningbo 315100, China
A compact spectrometer on silicon is proposed and demonstrated with an ultrahigh resolution. It consists of a thermally-tunable ultra-high-Q resonator aiming at ultrahigh resolution and an array of wideband resonators for achieving a broadened working window. The present on-chip spectrometer has a footprint as compact as 0.35 mm2, and is realized with standard multi-project-wafer foundry processes. The measurement results show that the on-chip spectrometer has an ultra-high resolution ?λ of 5 pm and a wide working window of 10 nm. The dynamic range defined as the ratio of the working window and the wavelength resolution is as large as 1940, which is the largest for on-chip dispersive spectrometers to the best of our knowledge. The present high-performance on-chip spectrometer has great potential for high-resolution spectrum measurement in the applications of gas sensing, food monitoring, health analysis, etc. A compact spectrometer on silicon is proposed and demonstrated with an ultrahigh resolution. It consists of a thermally-tunable ultra-high-Q resonator aiming at ultrahigh resolution and an array of wideband resonators for achieving a broadened working window. The present on-chip spectrometer has a footprint as compact as 0.35 mm2, and is realized with standard multi-project-wafer foundry processes. The measurement results show that the on-chip spectrometer has an ultra-high resolution ?λ of 5 pm and a wide working window of 10 nm. The dynamic range defined as the ratio of the working window and the wavelength resolution is as large as 1940, which is the largest for on-chip dispersive spectrometers to the best of our knowledge. The present high-performance on-chip spectrometer has great potential for high-resolution spectrum measurement in the applications of gas sensing, food monitoring, health analysis, etc.
Introduction
Spectrometers are of great importance in our scientific research and daily life, such as drug analysis, environmental monitoring, gas sensing and aerospace1. However, traditional spectrometers based on free-space optics are usually cumbersome and expensive2. Fortunately, the appearance of on-chip spectrometers makes it possible for realizing low-cost and portable spectrum measurement3. Various on-chip spectrometers have been developed successfully with silica, silicon nitride (SiN), or silicon photonic waveguides3-22. Among them, the platform of silicon-on-insulator (SOI) is very attractive because of the high refractive index-contrast and the CMOS compatibility makes it ideal for developing ultra-compact and low-cost systems-on-a-chip23-25. As it is well known, high resolution is highly desired for spectrometers used for microbiology, chemical analysis, food monitoring and gas sensing, where fine spectrum identification is required5. Meanwhile, it is also necessary to cover a suitable working bandwidth to achieve sufficient measurement dynamic range.
Currently there are mainly two kinds of on-chip spectrometers. One is using dispersive elements and the other one is using the spectral reconstruction method. For dispersive spectrometers, the key is the dispersive element, such as arrayed-waveguide gratings (AWGs)6, 7, etched diffraction gratings (EDGs)8-10, and arrayed microrings11. For AWG/EDG spectrometers, it is usually difficult to achieve high-performance silicon AWGs/ EDGs with very narrow channel spacings and thus the spectrometer resolution is usually limited to be around 0.2 nm or more6, 8, 9. In contrast, when using arrayed microrings, the resolution is determined by the Q-factor of the microrings and can be pretty high. However, it is difficult to achieve uniform channel spacing for a high-Q microring array due to the fabrication errors.
Compared with the dispersive spectrometers, Fourier spectrometers based on the spectral-reconstruction method is attractive due to the simplicity of the device structure. In this case, the resolution is dependent on the maximal optical path difference between the two interference arms. For traditional on-chip Fourier spectrometers13, the optical path difference is usually modified thermally. As a result, the resolution is limited by the maximal heating temperature. For example, it is possible to achieve the resolution of 7.6 nm even with a heating power of ~1 Watt. Alternatively, digital Fourier spectrometers14 can achieve a large optical path difference easily by controlling the status of optical switches, in which way the power consumption can be reduced greatly. However, it is still very challenging to realize a high resolution because of the large area occupation, the complicated control systems as well as the spectral reconstruction process. More recently, a miniature nanowire spectrometer was reported recently with a broadband light reconstruction from the different spectral response functions along the length of the bandgap-graded nanowire17. However, it still needs special nanowire-assembling techniques and the sensitivity is limited due to weak light absorption.
In this paper, we propose and demonstrate an ultra-high-resolution on-chip spectrometer by cascading a thermally-tunable ultrahigh-Q resonator and a wideband resonator array with Nchannels. The tunable ultrahigh-Q resonator has a very narrow 3-dB bandwidth and enables ultra-high-resolution wavelength-selective filtering. Meanwhile, the tunable ultrahigh-Q resonator has a free spectral range (FSR) close to the channel spacing of the N-channel wideband resonators. In this way, the working window for the ultra-high-resolution on-chip spectrometer can be extended to be beyond the limitation of its FSR. Our experimental results show that the present on-chip spectrometer has a footprint as compact as 0.35 mm2 and a resolution as high as 0.005 nm, which is the highest for on-chip dispersive spectrometers to the best of our knowledge. The working window is about 10 nm and correspondingly the ratio between the work window and the resolution is as large ~2000, which is the record for spectrometers with a footprint less than 1 mm2. It is expected that the present ultra-high resolution on-chip spectrometer will play an important role in environmental monitoring, aerospace and many other fields, especially in the field of spectral analysis integrated with smart phones.
Principle and design
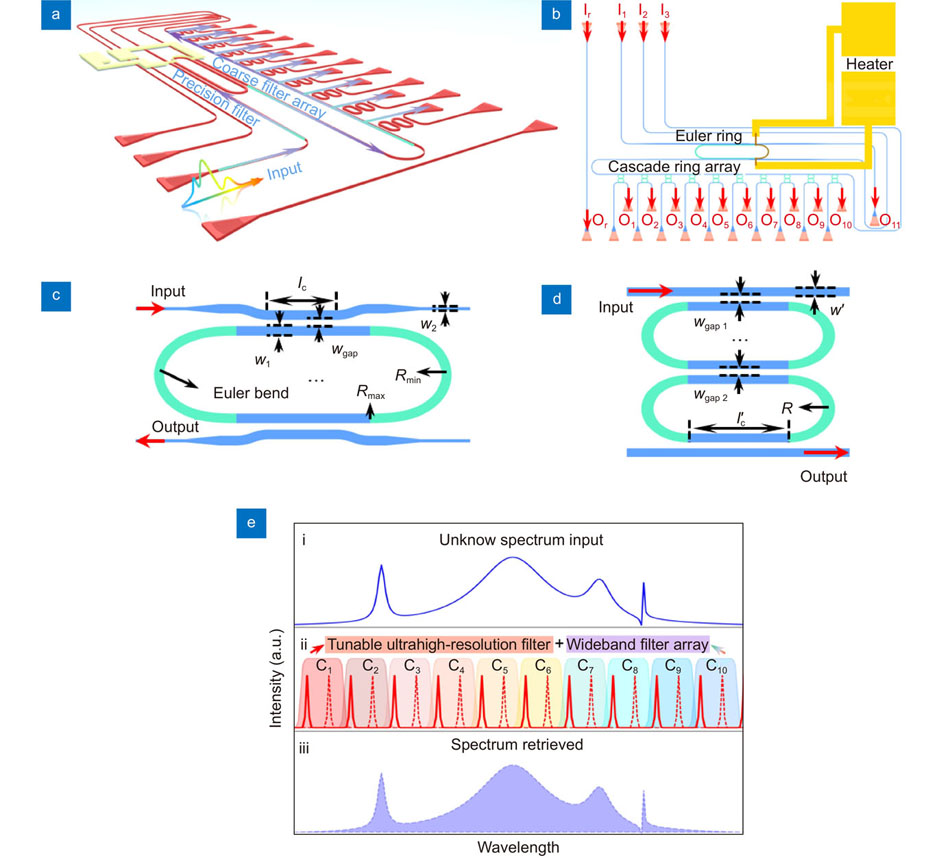
Figure 1(a–b) show the three-dimensional view and the top view of the proposed ultra-high-resolution on-chip spectrometer. It consists of a thermally-tunable ultra- high-Q resonator aiming at ultrahigh resolution and an array of wideband resonators with N channels for achieving a broadened working window, as shown in Fig. 1(c–d). The principle of the spectral retrieved process is shown in Fig. 1(e). Here the unknown input spectrum Iin(λ) is prefiltered by the thermally-tunable ultra-high-Q resonator whose transmission is given by TI(λ, Ph), where Ph is the applied heating power. Here the i-th resonance wavelength λi is dependent on the heating power Ph, and one has λi=λi0 +Ph (∂λ/∂Ph), where λi0 is the resonance wavelength when no heater power is applied (i.e., Ph=0 mW). It indicates that there is a one-to-one map connecting the resonance wavelength λi and the heating powerPh. The prefiltered spectrum has multiple resonance peaks and then are divided into N parts of sub-spectrum by the N-channel wideband resonators. Each part of sub-spectrum can be retrieved from the measured transmission TII_i(λ) at the output port of the corresponding wideband resonator in cascade as the heating power scans. All the wideband resonators are designed optimally, so that the transmission TII_i(λ) has a 3-dB bandwidth less than the FSR of the ultra-high-Q resonator, in which way no more than two resonance peaks can be dropped when tuning the ultra-high-Q resonator thermally. Finally, the total transmission for the i-th output-channel of the spectrometer is given by Ti(λ, Ph)=TI(λ, Ph)TII_i(λ). Accordingly, the detected signal Iout_i(Ph) output from the i-th wideband resonator (i=1
N) is given by
Figure 1.The 3D view (a) and the top view (b) of the present ultra-high-resolution on-chip spectrometer. Schematic configurations of the ultra-high-Q resonator (c) and the wideband resonator (d). (e) The principle of the spectrum retrieved process.
Note that the transmission Ti(λ, Ph) has an ultra-narrow resonance peak at λi when the resonance peak of the ultra-high-Q resonator locates within the 3 dB-bandwidth of the cascaded wideband filter. As a result, one has
Finally, the i-th part of the input spectrum Iin(λi) can be retrieved with the help of the wavelength/heating-power map, i.e.,
In addition, the wideband resonators are designed to have a 3-dB bandwidth close to the channel spacing in order to achieve high signal-to-noise ratios. For the signal prefiltered by the tunable ultrahigh-Q resonator, the inter-channel crosstalk can be reduced greatly when the FSR of the ultrahigh-Q resonator is larger than the channel spacing of the multi-channel wideband resonators7. In this way, the working window for the ultra-high-resolution on-chip spectrometer can be extended to be beyond the FSR limitation. Meanwhile, only one heating process for the ultra-high-Q resonator is needed to retrieve the spectrum from all the channels of the wideband resonators. The wavelength/heating-power map can be established for each channel by simply calibrating the relationship between the working range of the wideband resonator, the original peak position of the ultrahigh-Q resonator and the heating efficiency.
Since the resolution of this spectrometer is mainly determined by the 3-dB bandwidth of the prefilter, we introduce an ultra-high-Q resonator enabled by choosing broadened waveguides beyond the singlemode regime26. In this way, the scattering loss due to the rough sidewalls can be significantly reduced. On the other hand, modified Euler bends with optimized maximal/minimal radii (Rmax and Rmin) are introduced to achieve sharp multimode waveguide bends with negligible higher-order mode excitation. The curvature radius of the modified-Euler bend is varied from the Rmaxto the Rmin, as defined by26
In this way, the designed resonator has a compact footprint, an ultra-high Q-factor as well as a relatively large FSR, which is attractive for realizing high-resolution on-chip spectrometers. For the array of wideband resonators, dual identical racetracks with optimized coupling coefficients are used to achieve flat-top responses27, 28. In order to achieve uniform channel spacing as desired for easy restoration, the resonance wavelengths for all the channels are adjusted by slightly modifying the length of the coupling region l'c instead of the bending radius R. For example, the width of the waveguides for the array of wideband resonators is chosen as 420 nm to allow very sharp bending, the bending radius R is chosen as 5.72 μm and the initial l'c is 4.8 μm, and the length l'c of the coupling region is increased for the dual-racetrack with a tiny step of 0.057 μm to realize a uniform channel spacing of about 1 nm.
Accordingly, the FSR is about 12 nm. Meanwhile, the gap widths wgap1 and wgap2 are chosen optimally as 200 nm and 352 nm with the power coupling coefficients of (k1, k2) = (0.31, 0.034) for realizing a flat-top response with a 3-dB bandwidth of about 1 nm28. The wideband resonator has a relatively large fabrication tolerance, and there is no notable distortion even when the core width has some deviation of Δw=±20 nm. For the ultrahigh-Q resonator, the core width was chosen to be 1.6 μm in order to reduce the propagation loss, while the radii Rmax and Rmin for the 180° Euler bends are respectively optimized to be 600 μm and 15 μm for minimizing the transition loss and the inter-mode crosstalk. With such a design, the insertion loss for the 180° Euler bend is less than 0.003 dB, while the inter-mode crosstalk is lower than −30 dB in the broad band from 1500 nm to 1600 nm. The coupling regions of the add-drop ultra-high-Q resonator are symmetrical and the power coupling coefficient is chosen as 0.007. Even though the critical coupling condition is not satisfied in this design, the transmission at the drop has an acceptably low loss of about 2.3 dB. The total optical path length of the ultrahigh-Q resonator is about 1470 μm, and the FSR is about 1.65 nm accordingly. The footprint of the ultrahigh-Q resonator and a single wideband filter is as compact as 6.3 ×10⁻³ mm2 and 3.8 ×10⁻⁴ mm2, respectively. The total footprint of the present spectrometer chip is within 0.35 mm2. When it is desired to have wider working window by introducing more channels of the second stage of wideband resonators, the footprint increases linearly with the channel number.
Fabrication and measurement
The designed ultrahigh-resolution spectrometer was fabricated by the MPW foundry (Institute of Microsystems, China) with standard processes of UV lithography and inductively-coupled plasma dry-etching. A 2-μm-thick silica layer was deposited on the top as the upper-cladding, and the 100/5-nm-thick Ti/Au heater was post-fabricated by evaporation for thermal-tuning. Figure 2(a–e) shows the microscope/SEM images of the ultrahigh-resolution spectrometer chip, the grating coupler, the wideband resonator, the Euler bend in the ultrahigh-Q resonator, and the Ti/Au micro-heater, respectively.
Figure 2.(a) Microscope images of the fabricated ultrahigh-resolution spectrometer. Zoom-in views of the grating coupler (b), the wideband resonator (c), the Euler bend (d), and the heater on ultra-high-Q resonator (e).
In order to characterize the wideband resonators, an amplified spontaneous emission (ASE) light source was used and coupled into port I2, and the transmissions from the output ports (O1–O10) were measured by using a spectrum analyzer (OSA). Figure 3(a) shows the measured transmissions normalized with respect to the transmission of an adjacent straight waveguide connected with the same grating couplers. It can be seen that the 3-dB bandwidth and the channel spacing of the fabricated wideband resonator array are around 1 nm with excellent uniformity, which is consistent well with the design. The responses at the through/drop ports of the fabricated ultrahigh-Q resonator were characterized by measuring the transmissions at port O11 when the tunable laser source with a step size of 1 pm was respectively launched from ports I1 and I2. Figure 3(b) shows the measured results, which shows that the FSR is about 1.65 nm. Meanwhile, only the resonance peaks for the TE0 mode were observed, indicating that the higher-order modes in the broadened resonator waveguide are not excited almost. This is mainly owing to the optimal design of the Euler bends and the directional couplers. The inset of Fig. 3(b) shows the enlarged view for one of the resonance peaks for the TE0 mode, which show that the measured 3 dB bandwidth Δλ3dB is about 5 pm. Consequently, it is possible to achieve an ultra-high resolution. Figure 3(c) shows the measured resonance peak of the ultrahigh-Q resonator is tuned thermally with a tuning range of about 1.65 nm when applying an electrical heating power Ph of about 50.4 mW. The heating efficiency can be improved by introducing suspended structures in the future when needed. Figure 3(d) shows the resonance wavelength varies linearly as the heating power Ph increases, which is helpful to the spectrum measurement.
Ref
Configuration
Footprint (mm2)
Resolution (nm)
Bandwidth (nm)
Bandwidth/resolution
CMOS compatible
ref.6
AWG
64
0.2
1537-1557
100
Yes
ref.7
AWG+ring
9
0.1
1542-1569
270
Yes
ref.9
EDG+SCD
~100
9
600-2000
155.6
No
ref.8
EDG
9
0.5
1556-1566
20
Yes
ref.10
EDG+ring
2
0.1
1483-1493
100
Yes
ref.11
Micro-donut
~100
0.6
1540-1610
116
Yes
ref.19
PhC
5.67×10⁻³
10
1510-1590
8
Yes
ref.20
Disordered PhC
1.25×10⁻³
0.75
1500-1525
33.3
Yes
ref.21
CQD
~100
2-3
390-690
150
No
ref.18
Chirped-grating
448
0.3
580-650
233
Yes
ref.13
FTS
1
3
1522-1578
18.7
Yes
ref.22
FTS+ring
0.2
0.47
1526-1616
191.5
Yes
ref.14
DFT
1.8
0.2
1550-1570
100
Yes
ref.15
SHFT
>1
0.017
1550-1550.22
12.9
Yes
ref.16
HSDFT
13.87
0.0011
1550-15562
10714
Yes
ref.17
Nanowire
~0.1 mm
5
500-750
50
No
This work
Cascade ring+
Euler ring
0.35
0.005
1545.8-1555.5
1940
Yes
Table 1. Comparison of some typical spectrometers reported.
Figure 3.(a) Measured spectrum response of the fabricated 10-channel wideband resonators. (b) Measured spectral responses at the through/drop ports of the ultrahigh-Q resonator; Inset: the resonance peak. (c) The spectral response of the ultrahigh-Q resonator when applying different heating power. (d) The resonance wavelength as the heating power Ph increases. (e) The calibrated wavelength-power map. As an example, the arrow indicates the peak wavelength λi dropped by the i-th cascaded wideband resonator when the heating power Ph is 30 mW.
When using the present on-chip spectrometer for the spectrum measurement, the applied heating power Ph is scanned from 0 to 50.4 mW with a fine step of ∆Ph=0.029 mW and the corresponding optical power I(i, Ph) output from port Oi can be monitored (here i=1, …, 10). The scanning time step for sourcemeter 2400 is only ~1 ms, and the Thermo Electric Cooler (TEC) is applied to ensure the stability of temperature in the measurement. In order to retrieve the spectrum to be measured, one should establish the one-to-one map connecting the heating-power Ph and the corresponding peak wavelength λi(Ph) drop by the i-th channel (Ci) in the array of wideband resonators, which is achieved experimentally. Here the scanning step ∆Ph gives a very fine wavelength step of 1 pm. Figure 3(e) shows the established wavelength/heating-power map Ph~λiwith the thick lines. Here the resonance peaks (red) of the ultra-high-Q resonator and the envelope of all wideband resonators’ spectral responses are also shown. With this map, one can find the corresponding peak wavelengths λi for any given heating powerPh in the wavelength scanning. For instance, for a given heating power of 30 mW, the corresponding peak wavelengths corresponding to channels C1, C3, C4, C6, C8, and C10 are 1546.492, 1548.119, 1549.726, 1551.400, 1553.046, and 1554.696 nm, respectively, while no resonance peak is dropped by the 2-nd, 5-th, 7-th, and 9-th channels.
As an example, a tunable laser was used as the source to be measured. Here, the wavelength was set randomly to be 1546.61, 1549.45, and 1552.67 nm, respectively, and the linewidth of the tunable laser is about 0.8 fm. The corresponding spectral responses retrieved according to the monitored powers at ports O1–O10 are shown in Fig. 4(a–c). It can be seen that the retrieved spectrum is consistent with the original source. In particular, the peak wavelengths agree very well with each other, and the small difference is partially due to the external temperature variation and the wavelength precision of the tunable laser. Definitely, the linewidth of the retrieved spectrum is not as narrow as that of the tunable laser, which is reasonable according the 3-dB bandwidth (~5 pm) of the ultrahigh-Q resonator. As a comparison, the measure spectrum from a commercial optical spectrum analyzer (OSA AQ6370D) with a high resolution 0.02 nm is also shown by the purple curve. From these measured results, it is verified that the present spectrometer works with a much higher resolution than the commercial OSA.
Figure 4.Retrieved spectrum for a given spectrum with a single peak when using the present on-chip spectrometer as well as a commercial OSA with a resolution of 0.02 nm. (a) The peak wavelength is 1546.61 nm locating at channel C1. (b) The peak wavelength is 1549.45 nm locating at channel C4. (c) The peak wavelength is 1552.67 nm locating at channel C7.
In order to further characterize the resolution of the present on-chip spectrometer, we used the light source with two peaks provided by two tunable lasers with different wavelengths. Figure 5(a–c) shows the retrieved spectrums when the wavelengths (λ1, λ2) are chosen as (1552.627, 1552.632), (1552.024, 1552.624), and (1552.643, 1552.646) nm, respectively. It can be seen that the spectrum with two peaks can be retrieved successfully and definitely the two peaks become less distinguishable when the wavelength difference (λ2−λ1) becomes less than 5 pm, as shown in Fig. 5(c). As shown in the enlarged view of Fig. 5(a), the two peaks can still be distinguishable even when their difference (λ2−λ1) is as small as 5 pm. In contrast, the commercial OSA failed to distinguish the two peaks in Fig. 5(a) and 5(c) due to its limited resolution of 0.02 nm. This is consistent with the theoretical prediction regarding the Q-factor of the ultrahigh-Q resonator.
We also check the measurement for the spectrum generated from a real fiber Bragg grating filter, which has been used very widely. For the used Bragg grating filter, the central wavelength locates at 1551.4 nm and the 3-dB bandwidth is 0.8 nm. Figure 6 shows the spectrum measured with the present on-chip spectrometer as well as the original one. It can be seen that the central wavelength and the 3-dB bandwidth of the measured result agrees very well with the original spectrum. There were some minor peaks locating at 1550 nm and 1553 nm, resulting from the crosstalk from the adjacent channels.
Figure 6.Measured results for the spectrum generated from a commercial fiber Bragg filter.
Table 1 gives a comparison for the typical on-chip spectrometers reported in the recent years. It shows that those traditional grating-based dispersion elements (e.g., AWGs, EDGs) have mature designs while the device footprint is usually not compact (i.e., usually 10 mm2 or more)6-9, while the resolution is relatively low and limited to ~0.1 nm even with the help of the regular microring filters7. The spectrometers based on photonic crystal structures usually have a compact size, while it is still challenging to achieve a high resolution better than 0.5 nm19, 20. For Fourier spectrometers based on the spectral-reconstruction method, only one photodetector is needed and it is possible to achieve a large working window13, 14, 22. However, it still remains a challenge to achieve high reconstruction accuracy due to the limited optical path difference and the complex calibration process. Meanwhile, the realization of high resolution is at the cost of a large footprint more than 13 mm2 as well as sophisticated reconstruction mechanisms16. For the nanowire spectrometer17, the resolution is about 5 nm, which is limited by the unit size. Besides, it still needs well developed nanowire assembling technique for CMOS compatibility.
In contrast, the present on-chip spectrometer provides a promising option because it has a resolution as high as 5 pm and the working window is about 10 nm. Accordingly, the dynamic range defined as the ratio of the working window and the wavelength resolution is as large as 1940, which is one of the best. At the same time, the device has a footprint as compact as 0.35 mm2. Furthermore, the resolution can be improved further by improving the Q-factor of the resonator (which is possible29), while the working window can be extended easily by introducing more channels of wideband resonators with larger FSR30. Meanwhile, benefiting from the broadened waveguide and the system compactness, the present spectrometer is insensitive to the fabrication variation in the wafer scale, which greatly increases the uniformity of the chip system as well as the yield. Because of the ultra-high resolution and the compact footprint, the present spectrometer is expected to be used widely in various scenarios, such smartphone-based devices used for detecting the counterfeit pharmaceuticals, monitoring the skin health, or even determining the sugar and fat content in food products.
Conclusions
In summary, we have proposed and demonstrated an ultrahigh-resolution spectrometer on silicon. The spectrometer consists of a thermally-tunable ultra-high-Q resonator and an array of wideband resonators in cascade. The tunable ultrahigh-Q resonator is designed with an FSR close to the channel spacing of the wideband- resonator array. In particular, the ultra-high-Q resonator has been realized by introducing broadened waveguides assisted with compact modified-Euler-curve bends. The experimental results show that the demonstrated on-chip spectrometer has a footprint as compact as 0.35 mm2 and a resolution as high as 0.005 nm, which is the highest for on-chip dispersive spectrometers to the best of our knowledge. The working window is about 10 nm and the dynamic range defined as the ratio of the working window and the wavelength resolution is as large as 1940, which is one of the largest values. The wavelength resolution and the working window can be improved further with improved designs for the tunable resonator with higher Q-factor and the wideband resonators with larger FSR. Furthermore, the present spectrometer will be integrated with an array of Ge/Si photodetector on the same chip by using standard fabrication processes in our future work. As a result, it is expected to be useful for various applications, such as environmental monitoring, aerospace and many other fields.
References
[29] Zhang L, Hong SH, Wang Y, Yan H, Xie YW et al. New-generation silicon photonics beyond the singlemode regime. arXiv: 2104.04239 (2021).https://doi.org/10.48550/arXiv.2104.04239