• Chinese Optics Letters
  • Vol. 16, Issue 9, 090602 (2018)
Zahra Samavati, Alireza Samavati*, A. F. Ismail**, Mukhlis A. Rahman, and M. H. D. Othman
Author Affiliations
  • Advanced Membrane Technology Research Centre (AMTEC), University Technology Malaysia, Skudai 81310, Malaysia
  • show less
    DOI: 10.3788/COL201816.090602 Cite this Article Set citation alerts
    Zahra Samavati, Alireza Samavati, A. F. Ismail, Mukhlis A. Rahman, M. H. D. Othman. Intensity modulated silver coated glass optical fiber refractive index sensor[J]. Chinese Optics Letters, 2018, 16(9): 090602 Copy Citation Text show less
    Schematic diagram of Ag nanoparticles deposition processing as a sensing part on the surface of the fiber.
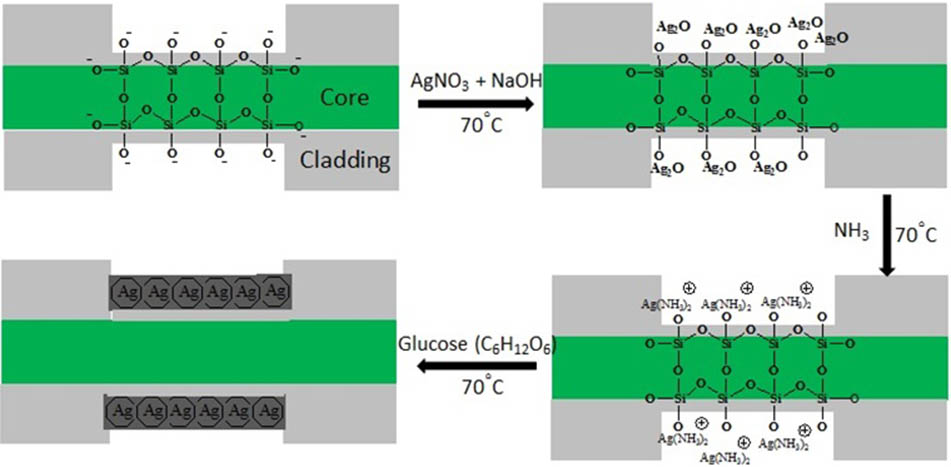
    Fig. 1. Schematic diagram of Ag nanoparticles deposition processing as a sensing part on the surface of the fiber.
    Schematic setup and working principle of an intensity modulated fiber optic sensor. P(1) and P(2) represent the incident and transmitted light intensity, respectively. The SPR at the interface of the Ag film and cladding is shown by the red wave symbol. The evanescent wave and its exponential decay are clearly seen in the right side of the figure.
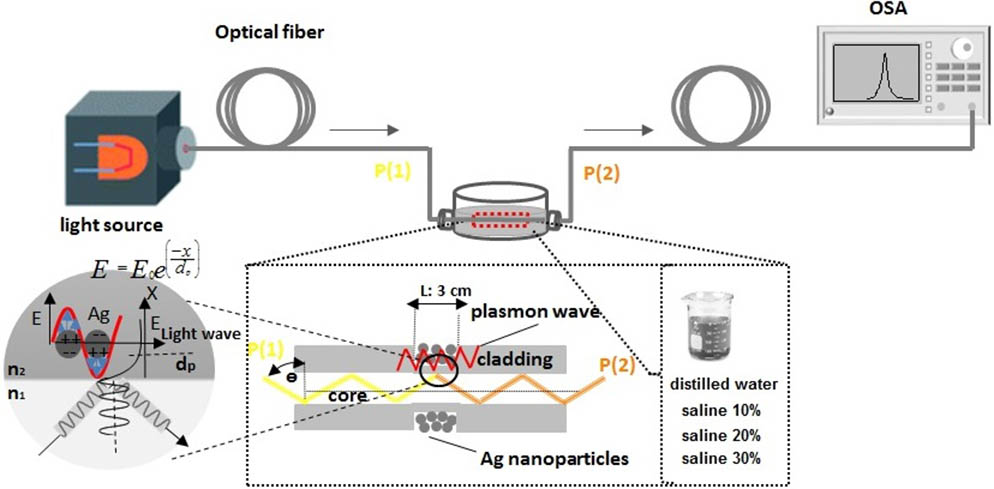
    Fig. 2. Schematic setup and working principle of an intensity modulated fiber optic sensor. P(1) and P(2) represent the incident and transmitted light intensity, respectively. The SPR at the interface of the Ag film and cladding is shown by the red wave symbol. The evanescent wave and its exponential decay are clearly seen in the right side of the figure.
    (a) UV-visible absorption, and (b) reflection and transmittance spectra of Ag nanoparticles on a glass substrate. (c) FESEM images of Ag nanoparticles synthesized using the chemical reduction method and (d) XRD pattern of Ag nanoparticles.
    Fig. 3. (a) UV-visible absorption, and (b) reflection and transmittance spectra of Ag nanoparticles on a glass substrate. (c) FESEM images of Ag nanoparticles synthesized using the chemical reduction method and (d) XRD pattern of Ag nanoparticles.
    FESEM images of (a) the surface view and (b) cross section of Ag nanoparticles coated on a glass fiber.
    Fig. 4. FESEM images of (a) the surface view and (b) cross section of Ag nanoparticles coated on a glass fiber.
    EDX mapping and spectra of a particularly selected area on the (a) sample surface and (b) cross section.
    Fig. 5. EDX mapping and spectra of a particularly selected area on the (a) sample surface and (b) cross section.
    Propagating light intensity as a function of wavelength for different refractive indexes in the (a) UV and (b) IR regions. (c) Light intensity in the LSPR (iii) area, inset shows the wavelength shift as a function of refractive index.
    Fig. 6. Propagating light intensity as a function of wavelength for different refractive indexes in the (a) UV and (b) IR regions. (c) Light intensity in the LSPR (iii) area, inset shows the wavelength shift as a function of refractive index.
    Sensitivity curve of the intensity modulated sensor for different applied light sources.
    Fig. 7. Sensitivity curve of the intensity modulated sensor for different applied light sources.
    Zahra Samavati, Alireza Samavati, A. F. Ismail, Mukhlis A. Rahman, M. H. D. Othman. Intensity modulated silver coated glass optical fiber refractive index sensor[J]. Chinese Optics Letters, 2018, 16(9): 090602
    Download Citation