Zahra Samavati, Alireza Samavati, A. F. Ismail, Mukhlis A. Rahman, M. H. D. Othman. Intensity modulated silver coated glass optical fiber refractive index sensor[J]. Chinese Optics Letters, 2018, 16(9): 090602
Copy Citation Text
Miniature optical fiber sensors with thin films as sensitive elements could open new fields for optical fiber sensor applications. Thin films work as sensitive elements and a transducer to get response and feedback from environments, in which optical fibers act as a signal carrier. A novel Ag coated intensity modulated optical fiber sensor based on refractive index changes using IR and UV-Vis (UV-visible) light sources is proposed. The sensor with an IR light source has higher sensitivity compared to a UV-Vis source. When the refractive index is enhanced to 1.38, the normalized intensity of IR and UV-Vis light diminishes to 0.2 and 0.8, respectively.
Several developments have been made in recent years in the use of fiber optic sensors. Multiple sensing applications have been revolutionized by representing fiber optic sensors[1–4]. The special properties of being non-electrical, small in size, rugged, and immune to electromagnetic interference boost the use of optical fibers for sensing applications in the fields of engineering, science, and technology. The physical properties, such as temperature[5], liquid level[6,7], radiation[8], strain, refractive index[9], vibration[10], concentration of liquid[11], and chemical analysis[12], can be detected by optical fiber sensors. Furthermore, low loss, low dispersion, ultra-wide bandwidth, high dynamic range, durability, upgradability, and low cost networks are other reasons for shifting the attention from traditional electrical sensors to optical fiber sensors. Compatibility to multimode fiber technology and simplicity of construction are two main advantages of intensity modulated sensors[13–17].
The decreasing in intensity of the incoming light in most optoelectronic devices, such as optical fibers and fiber sensors, is attributed to the absorption process. Optical fiber sensors based on evanescent absorption have attracted widespread attention in the last few years for the applications of distributed and remote sensing[18–20]. When light travels in the core by the total internal reflection process, some portion of the light escapes into the cladding as an evanescent wave, and the evanescent wave intensity is exponentially attenuated inside the cladding. This portion together with a number of reflections at the core and cladding interface gives rise to a decrease in the power propagating and causes attenuation of light along the fiber. Thus, the partially unclad glass rod is more useful as an attenuated total reflectance spectroscopic element[21].
Silver nanoparticles have been extensively studied owing to their unique optical properties, such as high reflectance and localized surface plasmon resonance (LSPR) in the UV-visible (UV-Vis) range, which can be utilized to develop nanoscale optical, chemical, and biological sensors[22–24]. LSPR of nanoparticles is generated by coherent oscillations of their surface free electrons when nanoparticles are irradiated by electromagnetic waves at the optical frequency. LSPRs have been widely used in various sensing devices due to their high sensitivity to the refractive index of the surroundings[25]. Reflective silica multimode optical fiber refractive index sensors coated with Ag nanoparticles were prepared by Chen et al., in which the wavelength shift of was observed when the refractive index changed from 1.33 to 1.40[26]. The photodeposition technique was employed to coat Ag nanoparticles at the end of the optical fiber as a sensor probe. The LSPR peak wavelength shift of to longer wavelengths was observed as the refractive index increased from 1 to 1.5[27].
Sign up for Chinese Optics Letters TOC. Get the latest issue of Chinese Optics Letters delivered right to you!Sign up now
The absorbance-based refractive index optical fiber sensor using a coated Ag nanoparticle encapsulated with graphene oxide as a sensing area was fabricated by Nayak et al.[28] They found that a 0.05 change in the refractive index causes increments in absorbance from 0.055 to 0.1.
Recently, tapered optical fiber sensors with Ag nanoparticles-based coatings have been developed for ammonia sensing[29], ethanol levels[30], and bacteria detection[31]. However, the simultaneous study of Ag coated unclad multimode optical fiber refractive index sensors with two different wavelength regions as a source power is not investigated extensively.
Therefore, in this study, Ag has been coated on partially removed cladding glass optical fibers as a sensing part, and this part is exposed to different concentrations of saline in order to measure the sensitivity against refractive index changes. Two different light sources are employed in order to compare the sensitivity of the sensors with a refractive index. Different optical characterizations and microscopic imaging techniques, such as absorption, reflection, emission spectra, and field emission scanning electron microscope (FESEM), as well as X-ray diffraction (XRD) for nanoparticle structural analysis, are employed for investigating the sensitivity of the device.
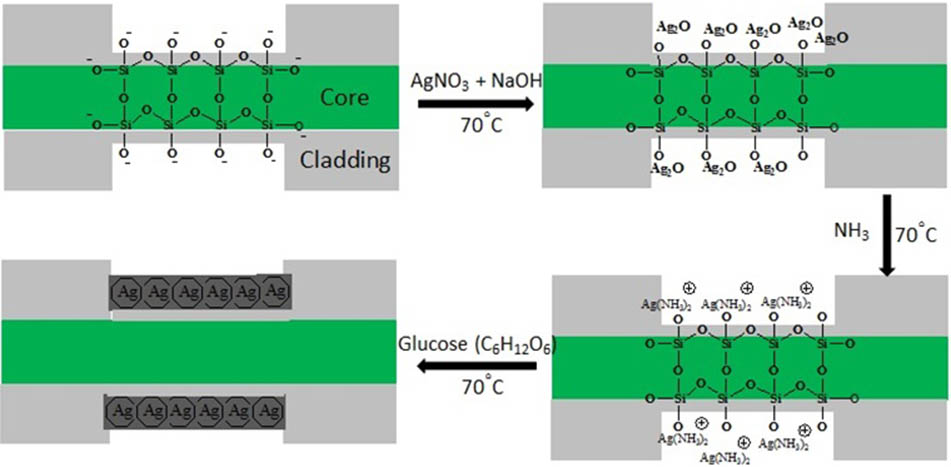
The optical fiber applied here is a kind of multimode coated glass fiber, which consists of a core with diameter of and a cladding with a diameter of . The Ag nanoparticles are coated on the fiber by the chemical reduction method. The mechanism of coating is given by the following equations, and the preparation procedures are depicted in Fig. 1.
(1)
(2)
(3)
In Eq. (1), the 3 cm length of the glass fiber cladding layer[32] is removed by 30% concentration hydrofluoric acid until the thickness of 600 nm achieved. This partially removed part is immersed and exposed into 20 mL, 0.1 mol/L solution. After that, 15 drops of 0.2 mol/L NaOH are added into the solution in order to convert Ag to and activate the surface of the removed part (brown precipitate appears). Then in Eq. (2), while gently shaking the glassware, a 2 mol/L ammonia is added drop-by-drop to the solution until the precipitate is completely dissolved (transparent solution). Finally in Eq. (3), a 10% concentration glucose solution is added, and the glassware is secured in 70°C water bath for 15 min. Eventually, the Ag thin film is formed on the surrounding surface of the fiber (Ag color). The sensitivity of our prepared optical fiber sensors to the refractive index changes is examined by the following setup which is illustrated in detail in Fig. 2.
Figure 1.Schematic diagram of Ag nanoparticles deposition processing as a sensing part on the surface of the fiber.
Figure 2.Schematic setup and working principle of an intensity modulated fiber optic sensor. P(1) and P(2) represent the incident and transmitted light intensity, respectively. The SPR at the interface of the Ag film and cladding is shown by the red wave symbol. The evanescent wave and its exponential decay are clearly seen in the right side of the figure.
To observe the deposited layers, the formation of Ag nanoparticles, and the elemental analysis, FESEMs (JEOLJSM 6380LA) attached with an energy dispersive X-ray (EDX) spectrometer are used. A broad band source with a laser wavelength ranging from 400 to 700 nm and the distributed feedback (DFB) laser diode with center wavelength are used as the light sources. An optical spectrum analyzer (OSA, ANDO AQ6317B) is employed as a detector. The structure of the Ag nanoparticles is studied using XRD (Bruker D8 Advance Diffractometer) with radiations (1.540 Å, 1 Å = 0.1 nm) at 40 kV and 100 mA. The scanning range of is from 30° to 80°. Also, speed of scanning with resolution of 0.011° is employed. The optical properties of Ag nanoparticles are evaluated by measuring the absorption, transmittance, and reflectance spectra with a UV-Vis near-IR (NIR) spectrophotometer (Shimadzu UV3600, Japan). The transmittance and reflectance spectra are measured with a 2 nm step length in the wavelength range of 350 to 1000 nm.
For investigating the optical properties and contributions to the resonance peak, Ag nanoparticles are irradiated with linearly polarized light parallel to the axes. The absorption, reflection, and transmittance spectra obtained by linearly polarized light from Ag nanoparticles on a glass substrate are plotted in Fig. 3. Based on the different number of electrons on the outer and next to last electron orbits, each group of metals in terms of electronic and optical properties behaves differently. In metals, strong absorption of light is accompanied with high reflectivity, as a result metallic surfaces act as excellent mirrors. Typically, light reflection is used to investigate the optical properties of metals. However, absorption and transmission experiments may contain very significant information that assists in observing and evaluating the effects in thin metal films. The greatest interesting effects are supposed to be observed in thin metal films with a critical thickness, which is the transition between continuous and island films. At this thickness, the films display anomalous optical properties in near UV and visible light instead of showing monotonous variation in absorption, transmission, and reflection spectra, which according to Beer–Lambert’s law is considered normal behavior. Generally, an incident electromagnetic wave interacts with metal by the mechanisms of absorption. However, some energy can pass through thin layers of metals.
Figure 3.(a) UV-visible absorption, and (b) reflection and transmittance spectra of Ag nanoparticles on a glass substrate. (c) FESEM images of Ag nanoparticles synthesized using the chemical reduction method and (d) XRD pattern of Ag nanoparticles.
The surface plasmon absorption of Ag is a phenomenon that is evident in the absorption spectra of the Ag films deposited on a glass substrate. According to the Mie theory, the Ag nanoislands with a diameter smaller than about 100 nm show a plasmonic resonance in the UV-Vis spectra, centered between 400 and 470–500 nm, depending on the size and, to some extent, on the surrounding (liquid) medium[33]. The absorption spectrum [Fig. 3(a)] is deconvoluted into three Gaussian shaped components at around 432, 548, and 621 nm. The peaks are assigned to the coupled surface plasmon resonance (SPR) modes in Ag dimers or Ag nanoparticle chains[34–36]. The scattering cross section at some wavelengths is enhanced due to interference of the incident and reflected light at specific wavelengths, which cannot be seen in an IR area.
It is clearly seen from Fig. 3(b) that the maximum reflection corresponding to the resonance peaks is found to be located near 580 to 630 nm. The broader reflection peaks measured in this plot are attributed to large variations in shape, size, and inter-particle distance. The peak at is attributed to the dipolar plasmon resonance of the nanoparticles in mutual interactions and interaction with the substrate. Figure 3(c) shows the FESEM image of Ag nanoparticles with an average size of 40 nm synthesized using the chemical reduction method. Most of the Ag nanoparticles were roughly circular in shape with smooth edges.
The crystalline size and structure of the Ag nanoparticles are investigated by XRD analysis, which is depicted in Fig. 3(d). The four distinct diffraction peaks at values of , , , and can be assigned as the planes of (1 1 1), (2 0 0), (2 2 0), and (3 1 1), respectively, indicating that the Ag nanoparticles have a fcc structure and are crystalline in nature [Joint Committee on Power Diffraction Standards (JCPDS) file No. 04-0783]. The broadening of Bragg peaks indicates the formation of nanoparticles. The mean size of Ag nanoparticles is calculated using the Debye–Scherrer’s equation[37], where is the average crystallite domain size perpendicular to the reflecting planes, is the X-ray wavelength, is the full width at half-maximum (FWHM), and is the diffraction angle. It is found that the calculated average size is from the FWHM of the peaks.
Figure 4 illustrates the cross section and surface view FESEM images of the Ag coated glass fiber. As can be seen, the Ag nanoparticles with the thickness of are successfully attached to the partially removed cladding area. The diameter of the removed cladding is measured to be 650 nm, which shows that only a small portion of cladding remains after the immersing and removing process. Considering the following formula, when the light wavelengths are 1550 and 610 nm, the penetration depths of the evanescent wave are 2.065 and 0.8076 µm, respectively, which confirms that removing a major part of cladding until [Fig. 4(b)] can assist the evanescent wave in reaching the Ag nanoparticles. These nanoparticles act as a mirror to partially reflect the evanescent wave inside the fiber at slightly different angles, which causes an increase in the number of total internal reflections, leads to a decrease in the propagating power, and reduces the light intensity at the end of the fiber.
Figure 4.FESEM images of (a) the surface view and (b) cross section of Ag nanoparticles coated on a glass fiber.
The penetration depth is given by[38]where is the wavelength of the light source, is the incident angle of light, and and are the refractive index of core and cladding, respectively.
Discontinuous structure of Ag film, which is clearly seen as the inset in Fig. 4(a), causes the light to escape confinement through the thin film. As the laser interacts with the core–cladding interface, a portion of the incident photons within the glass will penetrate into the external medium in the form of an exponentially decaying electromagnetic field, referred to as the evanescent field[39], which is schematically shown in Fig. 2. In situations where the cladding thickness is shorter than the penetration depth of this field, the peak of the field may protrude through the film and interact with the Ag thin film and a third external medium. Under such circumstances, the protruding peak may revert back into a propagating field and refract into the tertiary medium, having optically tunneled through the metal film. This optical tunneling is utilized in the sensor application to transmit the laser light into a measurand.
The importance of the Ag film in this case relates to the degree in which optical tunneling occurs. The effect is proportional to the evanescent wave protruding into the external medium, which is correlated to the refractive index and thickness of the cladding film. It has been demonstrated that regulating the thickness of the metal film along the waveguide and within the active area affords control over the location and intensity of energy transmission into the media. Consequently, for this example, the accurate characterizations of the metal film and cladding thicknesses as well as the Ag film structure are of paramount importance in appropriately exerting control over the beam propagation, both for maintaining confinement within the fiber and for transmitting the light into the external medium.
The corresponding EDX mapping and spectra for the selected area of the fiber surface and cross section are depicted in Figs. 5(a) and 5(b), respectively. In Fig. 5(a), the presence of the Ag element confirms the deposition of Ag on a partially uncladded area. The existence of C and O is attributed to double sided tape, which is used to fix the sample on the holder, and probably oxidation of the Ag nanoparticle due to exposure to atmosphere, respectively. The presence of Si with the highest intensity in the EDX related to cross section is attributed to the silica core of the fiber.
Figure 5.EDX mapping and spectra of a particularly selected area on the (a) sample surface and (b) cross section.
Figures 6(a), 6(b), and 6(c) show the transmitted spectrum with refractive index insensitivity for two different light sources. The refractive index of the surrounding area of Ag thin film is increased by using different concentrations of saline, which is schematically depicted in Fig. 2. Enhancing the refractive index of the surrounding media causes significant diminishment in the light intensity.
Figure 6.Propagating light intensity as a function of wavelength for different refractive indexes in the (a) UV and (b) IR regions. (c) Light intensity in the LSPR (iii) area, inset shows the wavelength shift as a function of refractive index.
If is the power transmitted by the fiber in the absence of a sensing medium, then the power transmitted along the fiber in the presence of a sensing medium is given by[40]where is the evanescent absorption coefficient of the sensing medium, and is the length of the sensing region. The evanescent absorption coefficient of a ray making an angle normal to the interface is given by[40]where is the core ratio, is the refractive index of the sensing media, is the refractive index of the cladding of the fiber, and is the bulk absorption coefficient. From the formula, it is clearly shown that by increasing the refractive index of surrounding media from 1 for air to 1.38 for 30% saline the transmitted light intensity should be decreased, which is in good agreement with our experimental results depicted in Figs. 6(a) and 6(b) for UV-Vis and IR sources, respectively.
When metal particles with sizes smaller than the wavelength of incident radiation are illuminated, electrons occupying the conduction band are driven by the applied electromagnetic field. The time harmonic motion of electrons in the nanoparticle results in polarization, which in turn causes a restoring force and leads to an oscillation (see schematic diagram in Fig. 2) with characteristics dependent on the material properties and geometry. Incident radiation having frequencies at the resonance condition of the oscillator leads to LSPR, which results in strong interaction of light with the nanoparticle. Three shoulders for all spectra in Fig. 6(a) are attributed to LSRP in different regions, which is consistent with the UV-Vis absorption spectra in Fig. 3(a).
Figure 6(c) illustrates the transmitted spectra in the specific range of LSPR (iii). By increasing the refractive index from 1 to 1.38, the red-shift of 1.35 nm in the spectra is clearly seen [inset in Fig. 6(c)]. LSPRs depend on the size, shape, and inter-particle interactions of the nanoparticles as well as the polarization of the medium. For a higher index of refraction, the dielectric function increases, which causes greater polarization of the medium and leads to attenuating of the accumulated charge in the resonance zone. By attenuating the electric charge of the nanoparticles, the restoring electric force is reduced. Reducing the restoring force diminishes the resonance frequency and leads to the red-shift in the transmitted spectrum. The occurrence of a small wavelength shift in our samples is attributed to agglomeration of nanoparticles and the formation of larger nanoparticles on the surface of cladding, which causes reduction of the effect of LSPR[41]. Furthermore, it is well known that in the region of 1550 nm wavelength, Ag nanoparticles do not have any light absorption and LSPR[42], and therefore, there is no shift is observed in the transmitted spectra.
The trend of diminishing intensity of transmitted light as a function of the surrounding refractive index, extracted from LSPR (iii) for the UV-Vis and propagating light spectra for the IR region, is plotted in Fig. 7. As it is clearly shown, the sensitivity of the optical fiber sensor is higher in the IR region compared to in the UV-Vis. Sensitivity is an important parameter of sensor performance. High sensitivity is usually preferable in practical applications. In the IR region with longer wavelengths, the imaginary part of the refractive index, which represents the absorption, is higher. Therefore, higher absorption by the surrounding media in the IR region occurred. Furthermore, the evanescent penetration depth and number of total internal reflections are higher in the IR region, which causes homogeneous and moderate light to arrive at the interface between the surface layer and the environment; as a result, more attenuation takes place and boosts the sensitivity compared to UV-Vis light.
Figure 7.Sensitivity curve of the intensity modulated sensor for different applied light sources.
The combination of fiber optics with nanostructure technologies and sensitive thin films offers great potential for the realization of novel sensor concepts. Therefore, the intensity modulated intrinsic glass optical fiber sensor is successfully fabricated via partially uncladding the fiber and coating it with sensitive material such as Ag nanoparticles. The FESEM and EDX analysis confirm homogeneous deposition of uncontained Ag nanoparticles on the surface of uncladded glass fiber. Increasing the refractive index of the surrounding environment from 1 to 1.38 results in diminishing the normalized intensity of propagated light to 0.8 and 0.2 in case of the UV-Vis and IR source, respectively, which indicate a higher sensitivity of the sensor in a longer wavelength source. The small red-shift of in the LSPR (iii) region is observed, which is attributed to reducing the restoring force by increasing the refractive index of the media. Our simple fabricated intensity modulated sensor has potential to be used for monitoring the oil and gas movement in reservoir and porous media.
Zahra Samavati, Alireza Samavati, A. F. Ismail, Mukhlis A. Rahman, M. H. D. Othman. Intensity modulated silver coated glass optical fiber refractive index sensor[J]. Chinese Optics Letters, 2018, 16(9): 090602

 (1)
(1) (2)
(2) (3)
(3)