
Yuzhen Liu, Jiarong Zhang, Sen Lin. Pose Estimation of Curved Objects Based on Binocular Vision and Vectors of the Tangent Plane[J]. Laser & Optoelectronics Progress, 2020, 57(4): 041506
- Laser & Optoelectronics Progress
- Vol. 57, Issue 4, 041506 (2020)
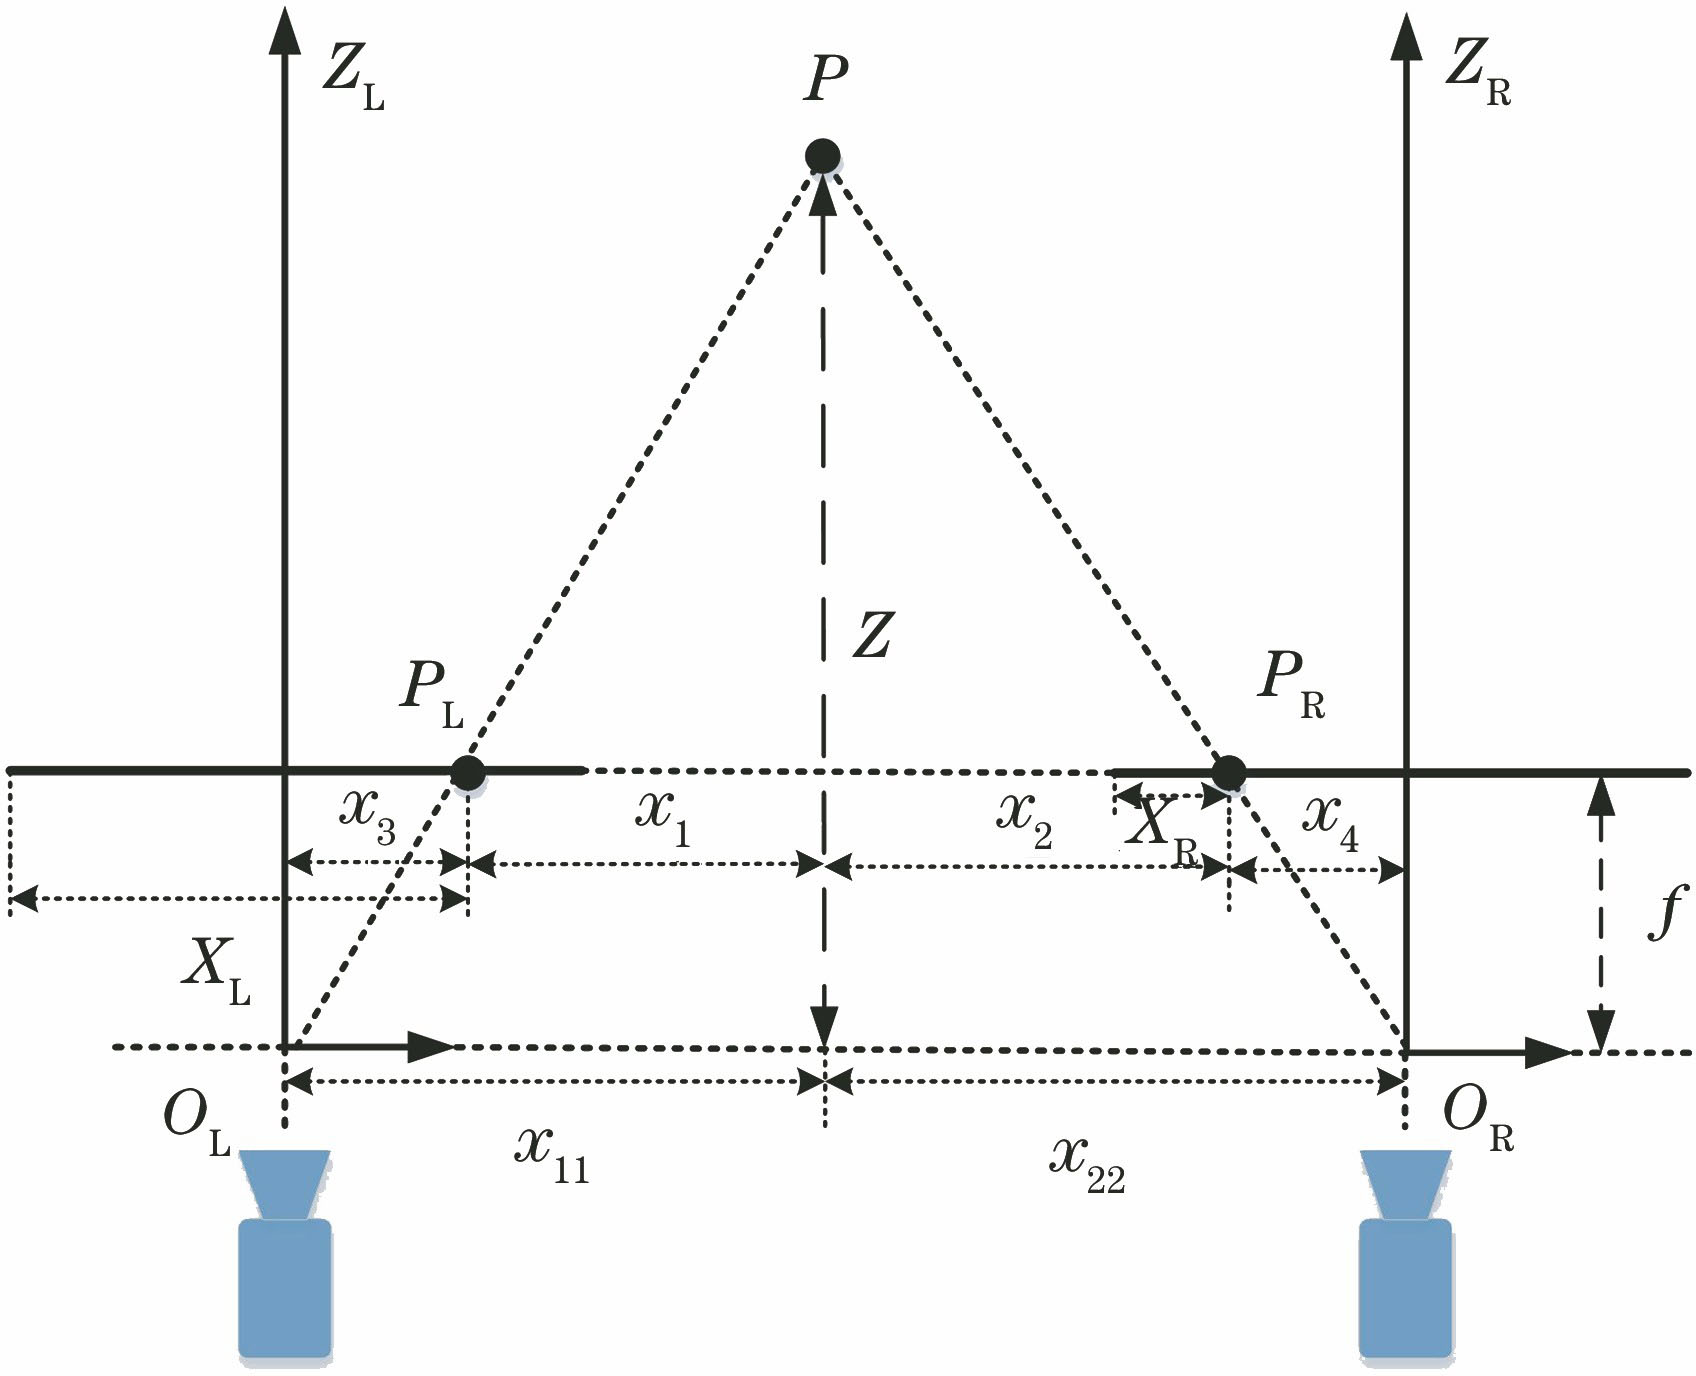
Fig. 1. Binocular vision measurement system model
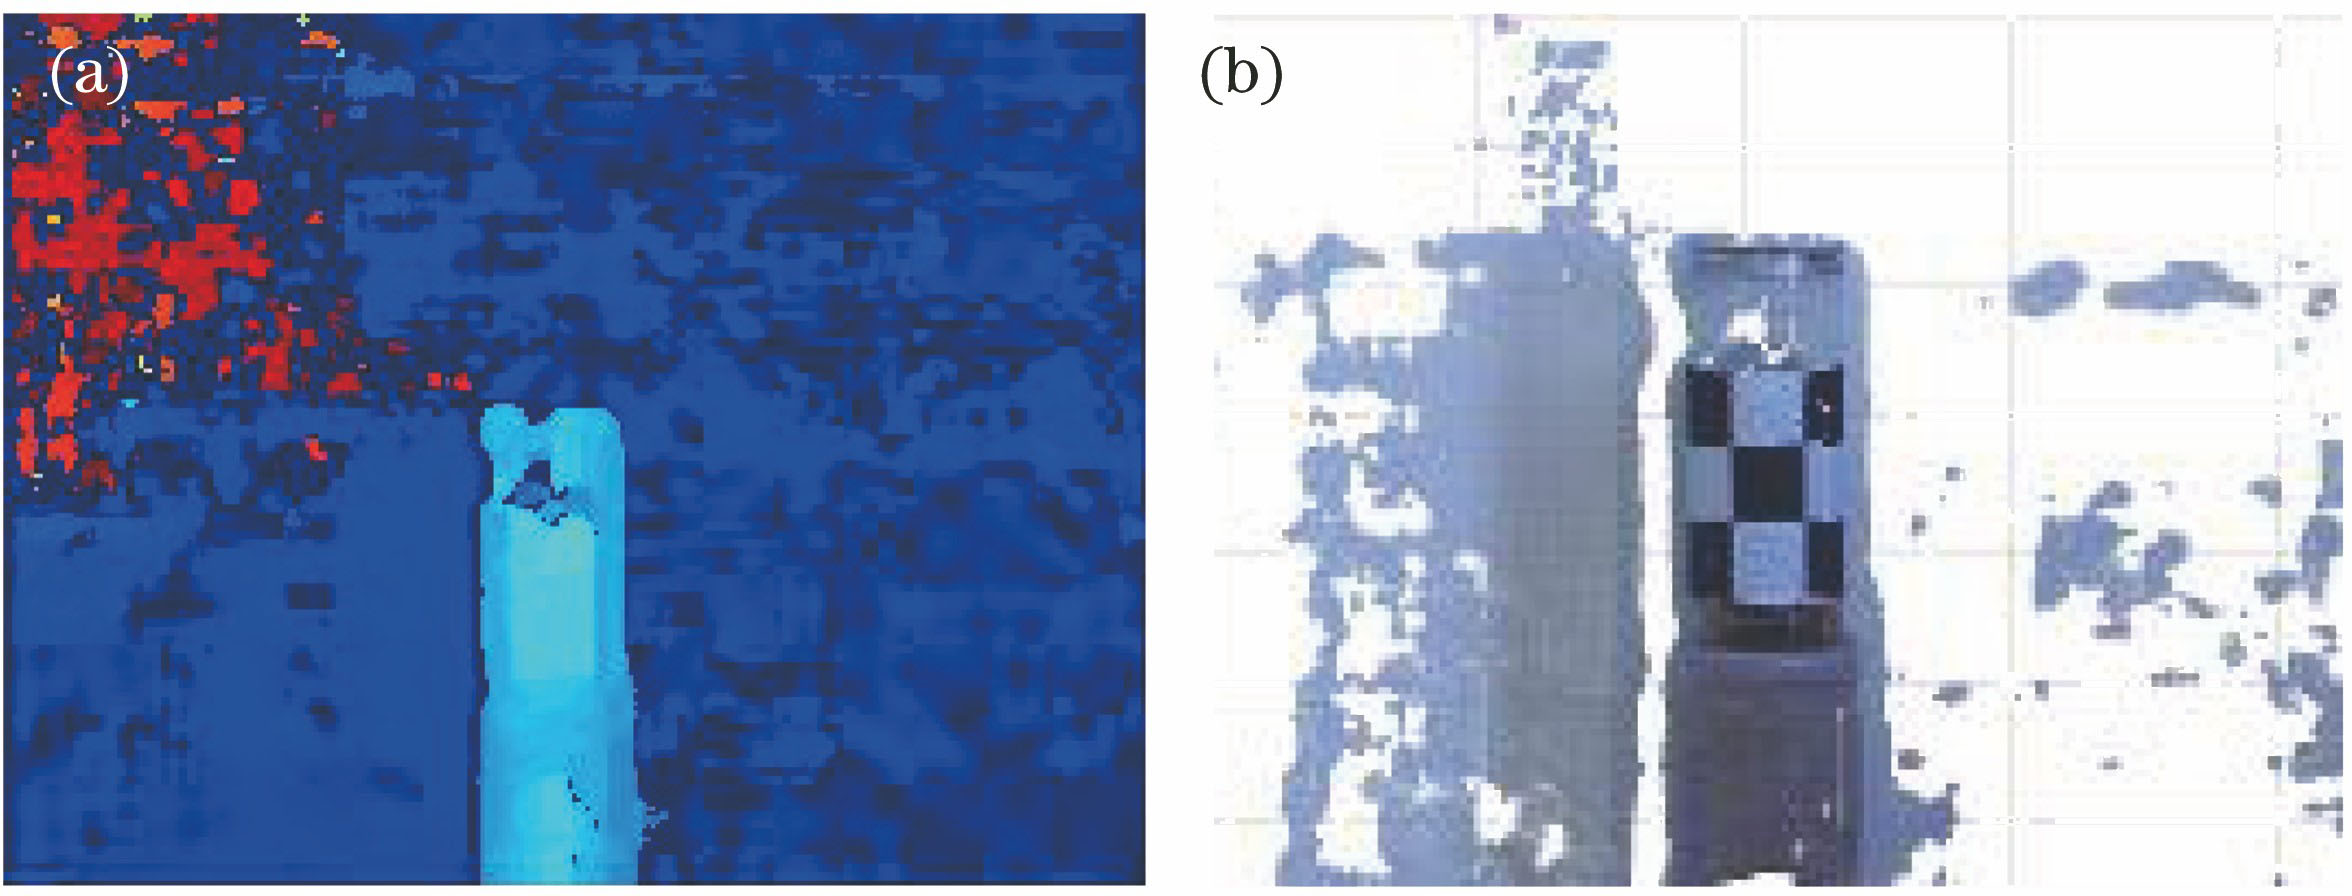
Fig. 2. Conversion from depth map to point cloud. (a) Depth map; (b) point cloud
Fig. 3. Schematic of rotation of 3D coordinate system. (a) Rotate around X axis; (b) rotate around Y axis; (c) rotate around Z axis
Fig. 4. Position representation of spatial point in world coordinate system
Fig. 5. Pose transformation of curved object
Fig. 6. Flow chart of the algorithm
Fig. 7. Experimental environment
Fig. 8. Experimental object. (a) Object 1; (b) object 2; (c) object 3; (d) object 4
Fig. 9. Selected target corner points
Fig. 10. Comparison of measurement errors of our algorithm and three monocular visual pose algorithms. (a) X-axis translation error; (b) Y-axis translation error; (c) Z-axis translation error; (d) rotation error around the X-axis; (e) rotation error around the Y-axis; (f) rotation error around the Z-axis
Fig. 11. Average error percentage of our algorithm and three monocular visual pose algorithms
Fig. 12. Comparison of measurement errors of our algorithm and two binocular visual pose algorithms. (a) X-axis translation error; (b) Y-axis translation error; (c) Z-axis translation error; (d) rotation error around the X-axis; (e) rotation error around the Y-axis; (f) rotation error around the Z-axis
Fig. 13. Average error percentage of our algorithm and two binocular visual pose algorithms
| |||||||||||||||||||||||||||||||||||||||||
Table 1. Estimation results of object 1 pose change
| |||||||||||||||||||||||||||||||||||||||||
Table 2. Estimation results of object 2 pose change
| |||||||||||||||||||||||||||||||||||||||||
Table 3. Estimation results of object 3 pose change
| |||||||||||||||||||||||||||||||||||||||||
Table 4. Estimation results of object 4 pose change
|
Table 5. Mean estimation error of each object
| |||||||||||||||||||||||||||||||||||||||||
Table 6. Comparison of calculation efficiency between COPE and ICP algorithm
| ||||||||||||||||||||||||||||||||||
Table 7. Comparison of calculation efficiency between COPE and NDT algorithm

Set citation alerts for the article
Please enter your email address
© Copyright 2018-2021 | Chinese Laser Press. All Rights Reserved 沪ICP备15018463号-20