
B. Martinez, S. N. Chen, S. Bolaños, N. Blanchot, G. Boutoux, W. Cayzac, C. Courtois, X. Davoine, A. Duval, V. Horny, I. Lantuejoul, L. Le Deroff, P. E. Masson-Laborde, G. Sary, B. Vauzour, R. Smets, L. Gremillet, J. Fuchs. Numerical investigation of spallation neutrons generated from petawatt-scale laser-driven proton beams[J]. Matter and Radiation at Extremes, 2022, 7(2): 024401
- Matter and Radiation at Extremes
- Vol. 7, Issue 2, 024401 (2022)
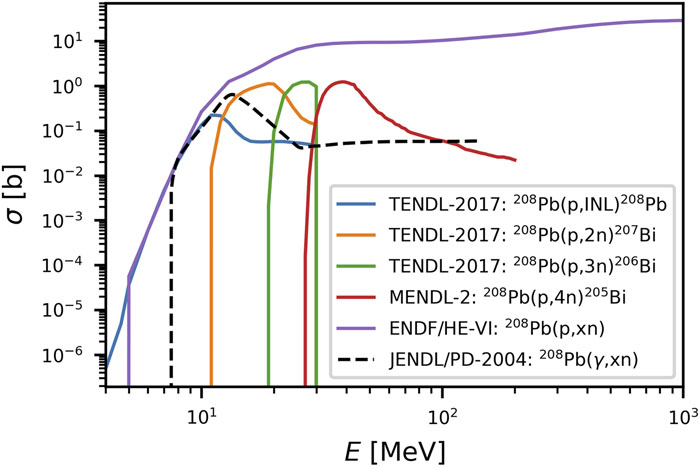
Fig. 1. Energy-differential cross sections of proton-induced nuclear reactions releasing different numbers of neutrons (solid curves) and of total neutron production by photonuclear reactions (black dashed curve) in Pb, as given by the ENDF/B-VIII database.34
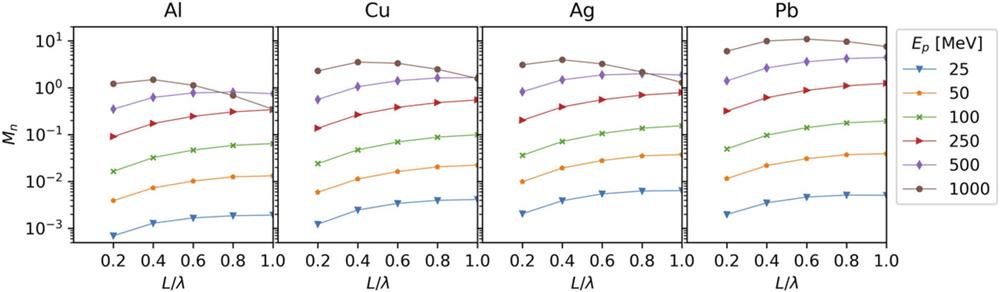
Fig. 2. Number of neutrons emitted per incident proton as a function of the target material and incident proton energy, as simulated by FLUKA.
Fig. 3. Conceptual setup of the numerical study.
Fig. 4. Longitudinal (x − p x ) phase space of the protons from the CALDER-CIRC simulation using the LMJ-PETAL parameters.
Fig. 5. Proton energy spectrum from the CALDER-CIRC simulation using the LMJ-PETAL laser parameters (blue curve). An experimental proton spectrum obtained at LMJ-PETAL (see the text for details) is plotted as orange dots.
Fig. 6. Proton acceleration using the 0.6 PW Apollon laser parameters: x − p x proton phase spaces at (a) t = −20 fs and (b) t = +4 fs (here t = 0 corresponds to the on-target laser pulse maximum). The blue line is the laser-cycle-averaged longitudinal electric field 〈E x 〉, extracted on axis (y = 0) and normalized to (a) 100E 0 or (b) 50E 0 for readability (E 0 = 3.2 × 10¹² V m−1).
Fig. 7. Proton acceleration using the 6 PW Apollon laser parameters: x − p x proton phase spaces at (a) t = −20 fs and (b) t = +4 fs (here t = 0 corresponds to the on-target laser pulse maximum). The blue line is the laser-cycle-averaged longitudinal electric field 〈E x 〉, extracted on axis (y = 0) and normalized to (a) 100E 0 or (b) 50E 0 for readability (E 0 = 3.2 × 10¹² V m−1).
Fig. 8. PIC-simulated proton spectra using (a) the 0.6 PW and (b) the 6 PW Apollon laser parameters. In (a), the integrated number of protons above 10 MeV is ∼1011, corresponding to a laser-to-proton energy conversion efficiency of ∼5%. In (b), there are 5 × 10¹¹ protons above 20 MeV, corresponding to a ∼12% conversion efficiency.
Fig. 9. Energy-angle spectrum of the neutrons escaping from a 0.3-mm-thick Pb converter target for (a) LMJ-PETAL, (b) 0.6 PW Apollon, and (c) 6 PW Apollon laser parameters.
Fig. 10. Energy fraction of the incident protons dissipated by nuclear reactions (blue) and transmitted through the target (green) as a function of the thickness l of the Pb converter target for (a) LMJ-PETAL, (b) 0.6 PW Apollon, and (c) 6 PW Apollon laser parameters.
Fig. 11. (a) Number (normalized to unit solid angle) and (b) maximum flux of the neutrons crossing the rear side of the Pb converter target, as a function of its thickness l. The incident proton beam is that predicted by PIC simulations in the LMJ-PETAL and 0.6–6 PW Apollon cases, as labeled.
Fig. 12. (a) Time-dependent neutron flux across the Pb converter backside for the LMJ-PETAL parameters. (b) Neutron energy spectra from a l = 0.3 mm Pb target in the LMJ-PETAL and 0.6–6 PW Apollon cases.
Fig. 13. Transverse size vs duration of the simulated neutron beam in the LMJ-PETAL, 0.6 PW Apollon, and 6 PW Apollon cases, and for various thicknesses, as indicated.
|
Table 1. Projected range λ (cm) for protons in various materials and for various energies.
|
Table 2. Parameters of the 2D CALDER PIC simulations performed for each considered laser system.


Set citation alerts for the article
Please enter your email address

© Copyright 2018-2021 | Chinese Laser Press. All Rights Reserved 沪ICP备15018463号-20