• Laser & Optoelectronics Progress
  • Vol. 58, Issue 5, 0514002 (2021)
Qianfeng Ding and Ming Pang*
Author Affiliations
  • Airport College of Civil Aviation University of China, Tianjin 300300, China
  • show less
    DOI: 10.3788/LOP202158.0514002 Cite this Article Set citation alerts
    Qianfeng Ding, Ming Pang. Thermal-Mechanical Coupling Simulation of High-Entropy Alloy Laser Cladding for Inner Barrel of an Oil Pump[J]. Laser & Optoelectronics Progress, 2021, 58(5): 0514002 Copy Citation Text show less
    Finite element model of laser cladding high entropy alloy.(a) Finite element model of laser cladding high-entropy alloy; (b) partially enlarged view of finite element model
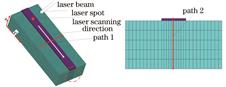
    Fig. 1. Finite element model of laser cladding high entropy alloy.(a) Finite element model of laser cladding high-entropy alloy; (b) partially enlarged view of finite element model
    Effect of laser power on temperature ( laser scanning speed of 5 mm·s-1). (a) Path 1; (b) path 2
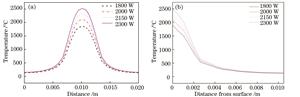
    Fig. 2. Effect of laser power on temperature ( laser scanning speed of 5 mm·s-1). (a) Path 1; (b) path 2
    Influence of laser scanning speed on temperature (laser power of 2000 W). (a) Path 1; (b) path 2
    Fig. 3. Influence of laser scanning speed on temperature (laser power of 2000 W). (a) Path 1; (b) path 2
    Residual stress field distributions (laser scanning speed of 5 mm·s-1,laser power of 2000 W). (a) Residual stress in x direction; (b) residual stress in y direction; (c) residual stress in z direction
    Fig. 4. Residual stress field distributions (laser scanning speed of 5 mm·s-1,laser power of 2000 W). (a) Residual stress in x direction; (b) residual stress in y direction; (c) residual stress in z direction
    Effect of laser power on maximum residual stress. (a) Maximum residual stress in x direction; (b) maximum residual stress in y direction
    Fig. 5. Effect of laser power on maximum residual stress. (a) Maximum residual stress in x direction; (b) maximum residual stress in y direction
    Effect of laser power on residual stress on path 1. (a) Residual stress in x direction; (b) residual stress in y direction; (c) residual stress in z direction
    Fig. 6. Effect of laser power on residual stress on path 1. (a) Residual stress in x direction; (b) residual stress in y direction; (c) residual stress in z direction
    Effect of laser power on residual stress on path 2. (a) Residual stress in x direction; (b) residual stress in y direction; (c) residual stress in z direction
    Fig. 7. Effect of laser power on residual stress on path 2. (a) Residual stress in x direction; (b) residual stress in y direction; (c) residual stress in z direction
    Effect of laser scanning speed on residual stress on path 1. (a) Residual stress in x direction; (b) residual stress in y direction; (c) residual stress in z direction
    Fig. 8. Effect of laser scanning speed on residual stress on path 1. (a) Residual stress in x direction; (b) residual stress in y direction; (c) residual stress in z direction
    Effect of laser scanning speed on residual stress on path 2. (a) Residual stress in x direction; (b) residual stress in y direction; (c) residual stress in z direction
    Fig. 9. Effect of laser scanning speed on residual stress on path 2. (a) Residual stress in x direction; (b) residual stress in y direction; (c) residual stress in z direction
    Laser cladding high-entropy alloy surface cracks as a function of laser power. (a) P=1800 W; (b) P=2000 W; (c) P=2150 W; (d) P=2300 W
    Fig. 10. Laser cladding high-entropy alloy surface cracks as a function of laser power. (a) P=1800 W; (b) P=2000 W; (c) P=2150 W; (d) P=2300 W
    Variation of crack quantity with laser power
    Fig. 11. Variation of crack quantity with laser power
    Laser cladding high-entropy alloy surface cracks as a function of laser scanning speed. (a) v=3 mm·s-1;(b) v=5 mm·s-1; (c) v=7 mm·s-1; (d) v=9 mm·s-1
    Fig. 12. Laser cladding high-entropy alloy surface cracks as a function of laser scanning speed. (a) v=3 mm·s-1;(b) v=5 mm·s-1; (c) v=7 mm·s-1; (d) v=9 mm·s-1
    Variation of crack quantity with laser scanning speed
    Fig. 13. Variation of crack quantity with laser scanning speed
    Temperature /℃Thermal conductivity /(W·m-1·℃-1)

    Specific heat capacity /

    (J·kg-1·℃-1)

    Density /

    (kg·m-3)

    Elasticity modulus/GPaPoisson ratio
    2547.684727.8242100.26
    10045.534807.8242050.26
    20040.444987.8241850.26
    40036.025607.8241850.26
    100024.026027.8241850.26
    Table 1. Thermal physical parameters of 45 steel
    Temperature /℃Thermal conductivity/(W·m-1·℃-1)

    Specific heat capacity /

    (J·kg-1·℃-1)

    Density /

    (kg·m-3)

    Elasticity modulus/GPaPoisson ratio
    25114308.02170.25
    200154538.02160.25
    400195008.02150.25
    600235228.02140.25
    1000318218.02130.25
    Table 2. Thermal physical parameters of high-entropy alloy FeCoNiCrAl
    Qianfeng Ding, Ming Pang. Thermal-Mechanical Coupling Simulation of High-Entropy Alloy Laser Cladding for Inner Barrel of an Oil Pump[J]. Laser & Optoelectronics Progress, 2021, 58(5): 0514002
    Download Citation