
Jianying Jing, Kun Liu, Junfeng Jiang, Tianhua Xu, Shuang Wang, Tiegen Liu. Highly sensitive and stable probe refractometer based on configurable plasmonic resonance with nano-modified fiber core[J]. Opto-Electronic Advances, 2023, 6(6): 220072
- Opto-Electronic Advances
- Vol. 6, Issue 6, 220072 (2023)
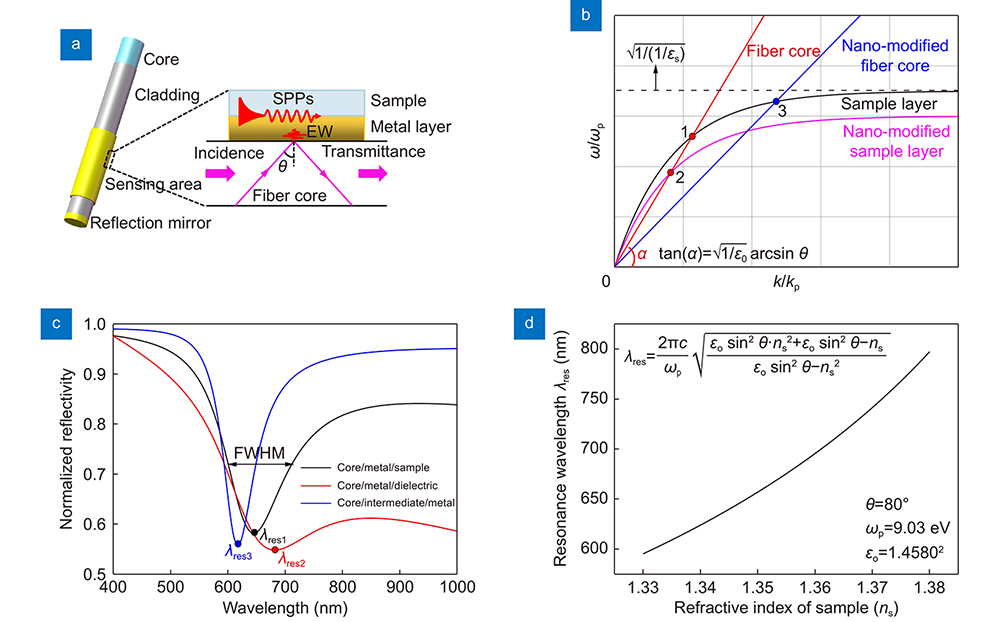
Fig. 1. (a ) Schematic of the sensing structure of the conventional fiber plasmonic resonance sensor. (b ) The dispersion model for configuring plasmonic resonance spectral characteristics. (c ) Plasmonic resonance spectra stimulated by different sensing structures. (d ) The variation of the resonance wavelength with the RI of the sample layer. ωp is the plasma frequency of Au.
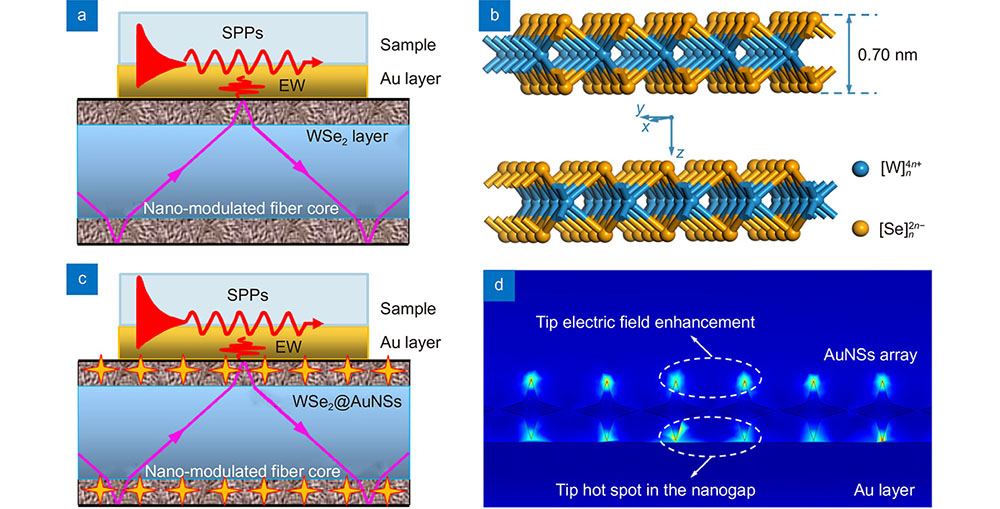
Fig. 2. Schematic of the sensing structure of (a ) the NMF-CPR sensor and (b ) the bilayer structure of WSe2 in the hexagonal crystal system. (c ) Schematic of the sensing structure of the tip hot spot enhanced NMF-CPR sensor. (d ) The tip electric field enhancement and the tip hot spot in the nanogap between AuNSs and the Au layer.
Fig. 3. (a ) The localized mode field distribution of the NMF-CPR sensor with a WSe2 layer of 10 nm and an Au layer of 50 nm. Inset: the overall mode field distribution around the fiber core. (b ) The vertical electric field distribution of the NMF-CPR sensor. Inset: the electric field distribution of the conventional fiber plasmonic resonance sensor with an Au layer of 50 nm. (c ) Initial loss peaks of NMF-CPR sensors with different thicknesses of Au layers. Inset: binomial fitting curves of resonance wavelengths and RI points. The tangent slope of each point on the curve represents the sensitivity of the sensor at the corresponding RI point. (d ) The sensitivity of NMF-CPR sensors with different thicknesses of Au layers corresponding to each RI. Inset: the sensitivity of conventional fiber plasmonic resonance sensors with different thicknesses of Au layers.
Fig. 4. (a ) The mode field distribution, (b ) the horizontal electric field distribution on the upper surface, (c ) loss spectra and (d ) the sensitivity at each RI point of the tip hot spot enhanced NMF-CPR sensor with a WSe2 layer of 10 nm, AuNSs of 40 nm, and an Au layer of 50 nm. The inset in (a) is an enlarged view of the mode field distribution around AuNSs. The color legend has been adjusted so that the electronic coupling is more clearly represented. The inset in (d) is the binomial fitting curve of resonance wavelengths and RI points. The tangent slope of each point on the curve represents the sensitivity of the sensor at the corresponding RI point.
Fig. 5. (a ) Initial resonance dips of NMF-CPR sensors with different thicknesses of Au layers. Inset: binomial fitting curves of resonance wavelengths and RI points. The tangent slope of each point on the curve represents the sensitivity of the sensor at the corresponding RI point. (b ) The sensitivity of NMF-CPR sensors with different thicknesses of Au layers corresponding to each RI. Inset: the sensitivity of conventional fiber plasmonic resonance sensors with different thicknesses of Au layers.
Fig. 6. (a ) Initial resonance dips of tip hot spot enhanced NMF-CPR sensors with different doping proportions (WSe2∶AuNSs). Inset: resonance spectra of the sensor with a doping proportion of 3∶1. (b ) The sensitivity of tip hot spot enhanced NMF-CPR sensors with different doping proportions corresponding to each RI. The average sensitivity of the sensors is 2142.07 nm/RIU, 2492.58 nm/RIU and 2995.70 nm/RIU, respectively. Inset: binomial fitting curves of resonance wavelengths and RI points. The tangent slope of each point on the curve represents the sensitivity of the sensor at the corresponding RI point. (c ) The FWHM of initial resonance dips and the FOM of the sensors with different doping proportions. (d ) Monitoring of the resonance wavelength of the tip hot spot enhanced NMF-CPR sensor with a doping proportion of 3∶1.
| |||||||||||||||||||||||||||||||||||||||||||||||||||||||||||||||||||
Table 0. Simulation results of spectral characteristics of sensors.
| |||||||||||||||||||||||||||||||||||||||||||||
Table 0. Comparison between the study in this work and reported works at similar RI ranges.
| |||||||||||||||||||||||||||||||||||||||||||||||||||||||||||||||||
Table 0. Experimental results of spectral characteristics of sensors.

Set citation alerts for the article
Please enter your email address
© Copyright 2018-2021 | Chinese Laser Press. All Rights Reserved 沪ICP备15018463号-20