• Opto-Electronic Advances
  • Vol. 6, Issue 6, 220072 (2023)
Jianying Jing1、2、3, Kun Liu1、2、3、*, Junfeng Jiang1、2、3, Tianhua Xu1、2、3, Shuang Wang1、2、3, and Tiegen Liu1、2、3
Author Affiliations
  • 1School of Precision Instruments and Opto-Electronics Engineering, Tianjin University, Tianjin 300072, China
  • 2Key Laboratory of Opto-Electronics Information Technology, Ministry of Education, Tianjin University, Tianjin 300072, China
  • 3Tianjin Optical Fiber Sensing Engineering Center, Institute of Optical Fiber Sensing, Tianjin University, Tianjin 300072, China
  • show less
    DOI: 10.29026/oea.2023.220072 Cite this Article
    Jianying Jing, Kun Liu, Junfeng Jiang, Tianhua Xu, Shuang Wang, Tiegen Liu. Highly sensitive and stable probe refractometer based on configurable plasmonic resonance with nano-modified fiber core[J]. Opto-Electronic Advances, 2023, 6(6): 220072 Copy Citation Text show less

    Abstract

    A dispersion model is developed to provide a generic tool for configuring plasmonic resonance spectral characteristics. The customized design of the resonance curve aiming at specific detection requirements can be achieved. According to the model, a probe-type nano-modified fiber optic configurable plasmonic resonance (NMF-CPR) sensor with tip hot spot enhancement is demonstrated for the measurement of the refractive index in the range of 1.3332–1.3432 corresponding to the low-concentration biomarker solution. The new-type sensing structure avoids excessive broadening and redshift of the resonance dip, which provides more possibilities for the surface modification of other functional nanomaterials. The tip hot spots in nanogaps between the Au layer and Au nanostars (AuNSs), the tip electric field enhancement of AuNSs, and the high carrier mobility of the WSe2 layer synergistically and significantly enhance the sensitivity of the sensor. Experimental results show that the sensitivity and the figure of merit of the tip hot spot enhanced fiber NMF-CPR sensor can achieve up to 2995.70 nm/RIU and 25.04 RIU−1, respectively, which are 1.68 times and 1.29 times higher than those of the conventional fiber plasmonic resonance sensor. The results achieve good agreements with numerical simulations, demonstrate a better level compared to similar reported studies, and verify the correctness of the dispersion model. The detection resolution of the sensor reaches up to 2.00×10⁻⁵ RIU, which is obviously higher than that of the conventional side-polished fiber plasmonic resonance sensor. This indicates a high detection accuracy of the sensor. The dense Au layer effectively prevents the intermediate nanomaterials from shedding and chemical degradation, which enables the sensor with high stability. Furthermore, the terminal reflective sensing structure can be used as a practical probe and can allow a more convenient operation.

    Introduction

    Fiber optic sensing technologies can realize the detection of nearly 100 types of parameters (e.g., displacement, acceleration, rotation, strain, temperature, refractive index (RI), current, magnetic field) based on the relationship between the characteristics of the transmitted light in the optical fiber and the surrounding parameters1, 2. These provide powerful research tools and monitoring methods for the fields of national security, major engineering, biomedicine, etc. Fiber optic plasmonic resonance technologies have advantages of high sensitivity, compact size, low cost and good flexibility, and can achieve remote, on-line, real-time, label-free and multi-parameter detection3, 4. Therefore, fiber optic plasmonic resonance sensors have wide application prospects in fields of biochemistry, environmental science and medical science5-7. However, the conventional fiber plasmonic resonance sensor with a structure of fiber/metal layer/sample can no longer well meet requirements of the current detection. Therefore, performance enhancement methods for indicators of the conventional fiber plasmonic resonance sensor, e.g., sensitivity, detection accuracy, have been widely investigated and are mainly categorized into the following three branches8.

    The first branch is to reasonably and flexibly design fiber substrates. Substrates can employ commercial fibers, e.g., multi-mode fiber9, hollow-core fiber10, multi-core fiber11, temperature-insensitive photonic crystal fiber (PCF)12, high-resolution long period fiber grating13 and tilted fiber grating14. Customized fiber structures, e.g., side-polished fiber (SPF)15, tapered fiber16 and U-shaped fiber17 can also be used as substrates to increase the leakage of the evanescent field to enhance the sensitivity. The second branch is to manage the response of the induced electromagnetic field by designing the sensing structure18, 19. Typical sensing structures include long-range plasmonic resonance20, nearly guided wave plasmonic resonance (NGW-PR)21, coupled plasmon waveguide resonance (CPWR)22, 23 and waveguide-coupled plasmonic resonance (WC-PR)24. The third branch is to employ the bimetallic layer such as Ag-Au layer25, zero-dimensional nanomaterials (e.g., nanoparticles26, nanoshells27), one-dimensional nanomaterials (e.g., nanotubes28, nanorods29, nanofibers30), and two-dimensional nanomaterials (e.g., graphene and derivatives31, phosphorene32, transition metal dichalcogenides (TMDCs)33, MXene34, perovskite35) to enhance the overlap integral of the electric field on the surface of the sensor to improve the sensitivity36. However, fiber plasmonic resonance sensors in the first branch are mainly produced based on transmission sensing structures37 that require fusion and customized sample cells in the detection of samples. This is not conducive to the convenient application. In the second branch, the sensitivity of CPWR based fiber optic sensors is relatively low and the full width at half-maximum (FWHM) of NGW-PR based and WC-PR based fiber optic sensors is relatively large8. In the third branch, the modification of multi-dimensional nanomaterials to the outer surface of sensors will greatly broaden the FWHM (more than 200 nm17, 38) and will reduce the detection accuracy39.

    In the field of life sciences, the research on the highly sensitive detection of biomarkers has great significance for the early screening of major diseases such as cancer. Fiber optic plasmonic resonance sensors are appropriate candidates for immunosensing based on antibody-antigen interactions. When the sensor is used to detect a type of antigen, the antibody coupling agent needs to be modified on the surface of the sensor to immobilize the corresponding antibody. The high RI sensitivity of the sensor can be converted into a signal response against the microscopic interaction between the antigen and the antibody via the coupling agent with excellent biocompatibility. However, the broadening and the redshift of the resonance dip is a general phenomenon for the antibody-antigen modification40. This requires that the resonance dip of the fiber plasmonic resonance sensor un-modified with biomolecules is located within a short spectral band, and the sensitivity of the sensor can be improved without significantly widening the FWHM. The signal of the resonance dip after the broadening and redshift will still be accurately demodulated in this way. When the fiber plasmonic resonance sensor is used for the immunosensing, the signal response is mainly induced by the surface RI change caused by the interaction of biomolecules41. When the fiber sensor is used for the direct detection of RI solutions, the signal is derived from the variation of the volume RI41. These indicate that the fiber plasmonic resonance sensor is essentially a refractometer42. Nevertheless, there are few in-depth studies on the RI sensing in the range around 1.3332 corresponding to low-concentration (nanogram or microgram per milliliter) and phosphate buffer solution-prepared biomarker solutions. Meanwhile, fiber plasmonic resonance sensors are often used in the real-time multi-parameter detection (e.g., different types of antigens, temperature) in practical applications. Each parameter corresponds to an independent resonance dip, and each resonance dip needs to be distributed in a separate spectral band to avoid the interference between resonance dips. Therefore, it is necessary to flexibly design the resonance curve (including multiple resonance dips) to meet the detection requirements. An analytical model that expresses the general relationship between the multi-layer sensing configuration and spectral characteristics of the resonance curve needs to be established.

    Based on above discussions, a dispersion model that can provide a generic tool for configuring plasmonic resonance spectral characteristics is proposed and developed. According to the model, a reflective nano-modified fiber optic configurable plasmonic resonance (NMF-CPR) sensor combined with the tip hot spot effect is implemented for the measurement of the RI in the range of 1.3332–1.3432 with an interval of 0.0025. Coating the plasmon-active nanomaterials under the Au layer effectively avoids the large redshift of the resonance dip and the excessive decrease in the detection accuracy caused by the broadening of the FWHM, while significantly enhances the sensitivity of the sensor. Additionally, the dense Au layer prevents the oxidation and the shedding of nanomaterials. This allows the sensor to detect liquid samples for a long time while to still keep good stability. The reflective sensing structure can be directly inserted into samples to achieve the rapid and convenient detection. By establishing the quantitative relationship between the plasmonic resonance signal and the RI of the sample, the concentration of the solution that causes the change of the RI and the biochemical interaction between the sensitive layer and the specific substance in the solution can be quantitatively analyzed.

    Results and discussions

    Theoretical analyses

    Principle of configuring plasmonic resonance spectral characteristics

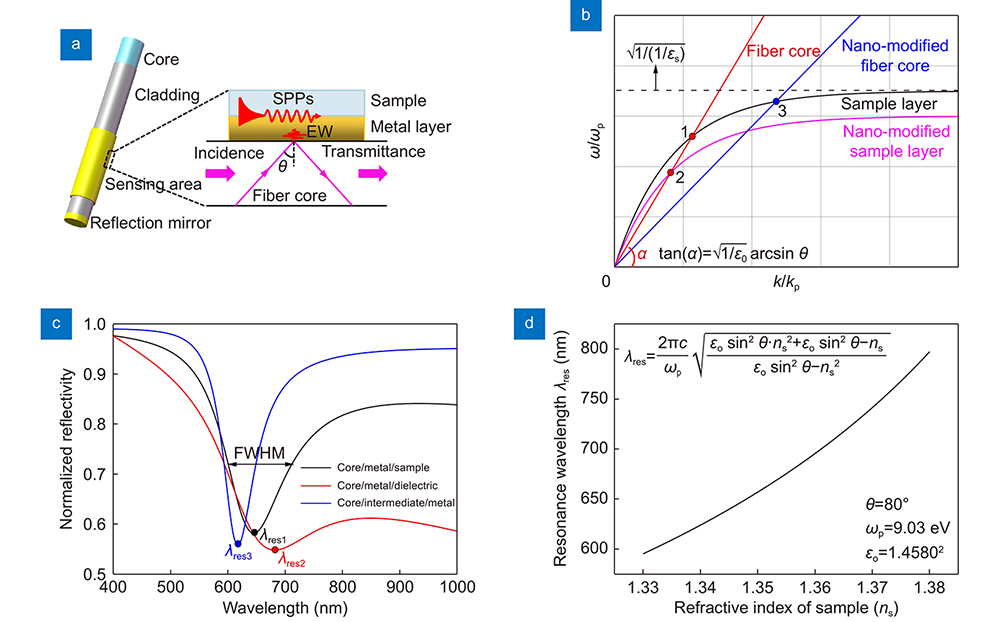
    The disassembly of the cylindrical surface in the optical fiber allows the plasmonic resonance at each point to be explained by a three-layer structure, as shown in Fig. 1(a). The wavevector component of the surface plasmon formed by the collective oscillation of free electrons on the surface of the metal layer is described as follows36:

    (a) Schematic of the sensing structure of the conventional fiber plasmonic resonance sensor. (b) The dispersion model for configuring plasmonic resonance spectral characteristics. (c) Plasmonic resonance spectra stimulated by different sensing structures. (d) The variation of the resonance wavelength with the RI of the sample layer. ωp is the plasma frequency of Au.

    Figure 1.(a) Schematic of the sensing structure of the conventional fiber plasmonic resonance sensor. (b) The dispersion model for configuring plasmonic resonance spectral characteristics. (c) Plasmonic resonance spectra stimulated by different sensing structures. (d) The variation of the resonance wavelength with the RI of the sample layer. ωp is the plasma frequency of Au.

    kSP=ωcϵmϵsϵm+ϵs,  

    where ω and c represent the frequency and the speed of the incident light (in vacuum), respectively, ϵm and ϵs represent dielectric constants of the metal layer and the sample, respectively. The wavevector component of the evanescent wave (EW), generated by the light which is projected on the surface of the metal layer from the substrate (assumed to be the optical fiber core), is given as follows36:

    kEW=ωcϵosinθ,  

    where ϵo and θ represent the dielectric constant of the optical fiber core and the incident angle of the incident light, respectively. Substituting the Drude model for the dielectric constant of a metal that ignores the damping term ϵm=1ωp2/ω2, where ωp represents the frequency of the surface plasmon, into Eqs. (1) and (2) followed by the dimensionless processing gives a convex function (black line in Fig. 1(b)) and a proportional function (red line in Fig. 1(b)), as expressed in Eqs. (3) and (4):

    kSPkp=ωωpϵs(1ωp2ω2)ϵs+1ωp2ω2,  
    kEWkp=ωωpϵosinθ,  

    where kp=ωp/c. The extreme value of Eq. (3) is 1/(1+ϵs), and the slope of Eq. (4) is 1/ϵoarcsinθ, respectively. Plasmonic resonance is stimulated when Eq. (3) is equal to Eq. (4). Substituting the relationship between the angular frequency ω and the wavelength λ of the incident light ω=2πc/λ and the relationship between the dielectric constant ϵs and the RI ns of the sample ϵs=ns2 into the equations gives the nonlinear relationship between the resonance wavelength (the minimum of the resonance dip, λres in Fig. 1(c)) and the RI ns of the sample, as expressed in Eq. (5):

    λres=2πcωpϵosin2θns2+ϵosin2θns2ϵosin2θns2.  

    The intersection Point 1 of the two wavevector components in Fig. 1(b) represents the above phase matching condition for the stimulation of the plasmonic resonance effect. Plasmon modes that satisfy the phase matching condition are coupled with incident photons in the energy. This forms surface plasmon polaritons (SPPs) which will propagate along the upper surface of the metal layer43.

    When the fiber optic plasmonic resonance sensor is used for the multi-parameter detection, the transmission spectrum contains multiple resonance dips44. In order to realize accurate multi-parameter detection, it is crucial to reasonably design the sensing structure in order to avoid the overlapping of resonance dips. According to above principle of the plasmonic resonance, the extreme value of Eq. (3) and the slope of Eq. (4) can be adjusted by introducing different types of nano-mediated layer or designing different sensing structures to achieve the plasmonic resonance with different resonance wavelengths. The specific position and the shift range of the resonance wavelength can be obtained via Eq. (5) as plotted in Fig. 1(d). This enables the flexible configuration of the plasmonic resonance spectral characteristics, and thus allows the customized design of the plasmonic resonance curve.

    Coating a dielectric layer with a high/complex dielectric constant on the upper surface of the metal layer in the conventional fiber plasmonic resonance sensor is equivalent to increasing the dielectric constant of the sample ϵs. The combination of the sample layer and the dielectric layer can be regarded as a nano-modified sample layer. This will reduce the extreme value of Eq. (3), as shown by the magenta line in Fig. 1(b). The resonance intersection will exhibit a shift from Point 1 to Point 2 (in Fig. 1(b)), indicating that the resonance occurs at a lower frequency, i.e., at a larger wavelength. Therefore, the resonance wavelength exhibits obvious redshift (from λres1 to λres2) compared to that of the conventional fiber plasmonic resonance sensor, as shown by the red curve in Fig. 1(c). The higher the dielectric constant of the dielectric layer, the larger the redshift range of the resonance dip. Although the dielectric layer can enhance the overlap integral of the electric field, thereby can improve the sensitivity, the dielectric layer also greatly increases the radiation loss of SPPs, and the FWHM is severely broadened39, 43, 45, as shown in Fig. 1(c). This thereby makes it difficult to accurately demodulate the resonance wavelength, and reduces the detection accuracy calculated by the reciprocal of the FWHM8, 17.

    NMF-CPR sensor/Tip hot spot enhanced NMF-CPR sensor

    According to above discussions, an NMF-CPR sensor with a new-type sensing structure of fiber core/intermediate layer/metal layer/sample layer is designed, as shown in Fig. 2(a). The quality of the plasmonic resonance stimulated by Au layer is ranked only second to that of Ag layer46, but Au layer has more excellent chemical stability than Ag layer. For the four TMDCs of MoS2, MoSe2, WS2 and WSe2, WSe2 has a porous layered structure, as seen in Fig. 2(b), with more excellent physicochemical stability and photoelectric properties47. For example, the carrier concentration and the carrier mobility of WSe2 are one to two orders of magnitude higher than those of the other three types of TMDCs, as shown in Table S1. This indicates that there will be more intense carrier transfer between the intermediate layer (i.e., WSe2 layer) and the metal layer. Therefore, in this work, Au and WSe2 have been employed to construct this type of performance enhanced fiber plasmonic resonance sensors. The combination of the fiber core and the WSe2 layer can be regarded as a nano-modified fiber core. The RI of the WSe2 layer is obviously higher than that (600 nm, 1.458048) of the silica core, so that the nano-modified fiber core has a higher equivalent RI no than that of the bare fiber core, as shown inFigs. S1(a) and S1(b). The detailed calculation for the equivalent RI has been attached in the Supplementary file. This will result in a higher equivalent ϵo and will reduce the slope of Eq. (4), as shown by the blue line in Fig. 1(b). The resonance intersection will exhibit a shift from Point 1 to Point 3 (in Fig. 1(b)), indicating that the resonance occurs at a higher frequency, i.e., at a smaller wavelength. Therefore, the resonance wavelength of the NMF-CPR sensor exhibits obvious blueshift (from λres1 to λres3) compared to that of the conventional fiber plasmonic resonance sensor, as shown by the blue curve in Fig. 1(c). The higher the RI of the intermediate layer, the larger the blueshift range of the resonance dip. WSe2 layer as a plasmon-active layer allows surface plasmons to propagate, but does not support the existence of guided modes36. The strong absorption of the light energy by the WSe2 layer promotes the mobility of electrons between the WSe2 layer and surface plasmons in the Au layer. This enhances the overlap integral of the electric field on the upper surface of the Au layer36. Therefore, the sensitivity of the NMF-CPR sensor is higher than that of the conventional fiber plasmonic resonance sensor. In addition, SPPs directly propagate at the interface between the Au layer and the sample with smaller radiation loss and larger propagation distance arising from the enhancement of the surface field. This thereby greatly reduces the FWHM of the sensor compared to that of the conventional fiber plasmonic resonance sensor, as shown in Fig. 1(c).

    Schematic of the sensing structure of (a) the NMF-CPR sensor and (b) the bilayer structure of WSe2 in the hexagonal crystal system. (c) Schematic of the sensing structure of the tip hot spot enhanced NMF-CPR sensor. (d) The tip electric field enhancement and the tip hot spot in the nanogap between AuNSs and the Au layer.

    Figure 2.Schematic of the sensing structure of (a) the NMF-CPR sensor and (b) the bilayer structure of WSe2 in the hexagonal crystal system. (c) Schematic of the sensing structure of the tip hot spot enhanced NMF-CPR sensor. (d) The tip electric field enhancement and the tip hot spot in the nanogap between AuNSs and the Au layer.

    We can achieve a higher sensitivity by doping a certain proportion of Au nanostars (AuNSs) into the WSe2 layer to construct a type of tip hot spot enhanced NMF-CPR sensor, as shown in Fig. 2(c). The potential metallic electromagnetic enhancers include the Au nanosphere26, the Au nanoshell27, the Au nanorod29, etc. Compared to commonly used Au nanosphere, the SPPs coupling between the inner and outer walls of the Au nanoshell can produce an enhancement of the electric field27. Nevertheless, the electric-field enhancement is more obvious on the surface of the inner wall that is not in contact with the sample. The anisotropy of the Au nanorod can generate transverse and longitudinal plasmonic resonance29. There may be overlap and signal interference between the resonance dips arising from above two types of resonance when the aspect ratio of the nanorod reaches some specific value. The tips on arms of AuNSs in our work can lead to a significant enhancement of the electric field49, as shown in Fig. 2(d). The tip hot spot effect arising from the intense near-field electronic coupling between the localized surface plasmon in AuNSs and the conventional surface plasmon in the Au layer, leads to a remarkable amplification of the localized electric field intensity on the Au layer surface and enables the sensor to have higher sensitivity50, 51.

    Numerical simulations

    NMF-CPR sensor

    The coupled-mode theory based finite element analysis (FEA)52 is employed to investigate spectral characteristics of NMF-CPR sensors. For the same multi-layer sensing structure of substrate/metal layer/dielectric layer/sample, no matter whether the substrate is multi-mode fiber9, SPF15, tapered fiber16, U-shaped fiber53 and prism32, the developed sensors display similar variation of sensitivity enhancement compared to the corresponding conventional sensors with a sensing structure of substrate/metal layer/sample. Our work is focused on the performance variation of the sensor when different sensing structures are configured. In order to obtain more significant plasmonic resonance, the SPF, that can produce larger evanescent field leakage and provide a plane on which complex sensing film can be flexibly configured, is employed to build FEA models, as shown in Fig. S2. The parameters used in simulations are shown in Fig. S3 and Table S3, respectively. The mode field energy of the fundamental mode is significantly higher than that of the higher-order modes54. Meanwhile, the loss spectrum corresponding to a higher-order mode and the loss spectrum corresponding to the fundamental mode have little difference in the peak wavelength, as shown in Fig. S4. The loss spectrum represents the loss caused by the coupling of the electromagnetic field energy in the core into SPPs due to the plasmonic resonance. The maximum in the loss spectrum represents the most significant resonance, so that the peak wavelength in the spectrum indicates the resonance wavelength55. Therefore, the spectral characteristics of NMF-CPR sensors can be obtained from the most representative loss spectra derived in the fundamental mode field. Simulation results are shown in Fig. 3, Fig. S5 and Table 1. According to Eq. (5), the binomial fitting replaces the commonly used linear fitting17 to express the relationship between the resonance wavelength and the RI.

    (a) The localized mode field distribution of the NMF-CPR sensor with a WSe2 layer of 10 nm and an Au layer of 50 nm. Inset: the overall mode field distribution around the fiber core. (b) The vertical electric field distribution of the NMF-CPR sensor. Inset: the electric field distribution of the conventional fiber plasmonic resonance sensor with an Au layer of 50 nm. (c) Initial loss peaks of NMF-CPR sensors with different thicknesses of Au layers. Inset: binomial fitting curves of resonance wavelengths and RI points. The tangent slope of each point on the curve represents the sensitivity of the sensor at the corresponding RI point. (d) The sensitivity of NMF-CPR sensors with different thicknesses of Au layers corresponding to each RI. Inset: the sensitivity of conventional fiber plasmonic resonance sensors with different thicknesses of Au layers.

    Figure 3.(a) The localized mode field distribution of the NMF-CPR sensor with a WSe2 layer of 10 nm and an Au layer of 50 nm. Inset: the overall mode field distribution around the fiber core. (b) The vertical electric field distribution of the NMF-CPR sensor. Inset: the electric field distribution of the conventional fiber plasmonic resonance sensor with an Au layer of 50 nm. (c) Initial loss peaks of NMF-CPR sensors with different thicknesses of Au layers. Inset: binomial fitting curves of resonance wavelengths and RI points. The tangent slope of each point on the curve represents the sensitivity of the sensor at the corresponding RI point. (d) The sensitivity of NMF-CPR sensors with different thicknesses of Au layers corresponding to each RI. Inset: the sensitivity of conventional fiber plasmonic resonance sensors with different thicknesses of Au layers.

    Table Infomation Is Not Enable

    It is found that the electric field intensity in the sample on the surface of the NMF-CPR sensor can reach up to 55.22 V/m, which is 1.45 times higher than that (38.17 V/m) of the conventional fiber plasmonic resonance sensor and this indicates an obvious enhancement of the surface field. Compared to the conventional fiber plasmonic resonance sensor, the initial loss peak (the loss peak corresponding to the RI of the pure water i.e., 1.3332) of the NMF-CPR sensor exhibits blueshift and narrowing. As the thickness of the Au layer increases, the initial loss peak of the NMF-CPR sensor exhibits redshift, the FWHM becomes larger, and the average sensitivity (the average of the sensitivity corresponding to five RI points of each sensor) of the sensor increases and is higher than that of the conventional fiber plasmonic resonance sensor. As the thickness of WSe2 layer increases, the average sensitivity of the sensor is improved. This demonstrates a greater contribution of WSe2 layer to the sensitivity enhancement. Above results agree well with theoretical analyses. The NMF-CPR sensor with a WSe2 layer of 10 nm and an Au layer of 50 nm shows the highest figure of merit (FOM, calculated via dividing the average sensitivity by the FWHM56) of 32.12 RIU–1 which is 1.30 times higher than that (24.71 RIU–1) of the conventional fiber plasmonic resonance sensor with an Au layer of 50 nm only.

    Tip hot spot enhanced NMF-CPR sensor

    As shown in Fig. 4(a) and 4(b), the electric field on the surface of the tip hot spot enhanced NMF-CPR sensor approximately obeys a normal distribution, and the peak electric field reaches 77.38 V/m which is 2.03 times higher than that (38.17 V/m) of the conventional fiber plasmonic resonance sensor with an Au layer of 50 nm. In the reported research works57, Au nanoparticles were modified on the outer surface of the Au layer. The strong enhancement of the electric field intensity was mainly generated in nanogaps between Au nanoparticles and the Au layer, but could not be sufficiently used to detect external samples. In our research work, AuNSs are located at the bottom of the Au layer. A small part of the enhanced electric field energy generated by the intense coupling between AuNSs and the Au layer is attenuated when passing through the Au layer, but most of the energy reaches the upper surface of the Au layer to directly detect the sample. Therefore, the electronic coupling is fully and effectively utilized.

    (a) The mode field distribution, (b) the horizontal electric field distribution on the upper surface, (c) loss spectra and (d) the sensitivity at each RI point of the tip hot spot enhanced NMF-CPR sensor with a WSe2 layer of 10 nm, AuNSs of 40 nm, and an Au layer of 50 nm. The inset in (a) is an enlarged view of the mode field distribution around AuNSs. The color legend has been adjusted so that the electronic coupling is more clearly represented. The inset in (d) is the binomial fitting curve of resonance wavelengths and RI points. The tangent slope of each point on the curve represents the sensitivity of the sensor at the corresponding RI point.

    Figure 4.(a) The mode field distribution, (b) the horizontal electric field distribution on the upper surface, (c) loss spectra and (d) the sensitivity at each RI point of the tip hot spot enhanced NMF-CPR sensor with a WSe2 layer of 10 nm, AuNSs of 40 nm, and an Au layer of 50 nm. The inset in (a) is an enlarged view of the mode field distribution around AuNSs. The color legend has been adjusted so that the electronic coupling is more clearly represented. The inset in (d) is the binomial fitting curve of resonance wavelengths and RI points. The tangent slope of each point on the curve represents the sensitivity of the sensor at the corresponding RI point.

    It can also be found from Fig. 4(c) and 4(d) that the initial loss peak of the sensor displays broadening and great redshift compared to the conventional fiber plasmonic resonance sensor. The average sensitivity and the FOM of the sensor can reach up to 3200.11 nm/RIU and 36.14 RIU–1, respectively, which are 1.78 times and 1.46 times higher than those (1800.14 nm/RIU and 24.71 RIU–1) of the conventional fiber plasmonic resonance sensor, respectively. Above results indicate the contribution of AuNSs array to the sensitivity enhancement of the sensor.

    Experimental results

    NMF-CPR sensor

    Experimental results are shown in Fig. 5, Fig. S6 and Table 2. Both the normalized reflectivity and the loss spectrum represent the loss of the optical field energy in the fiber caused by the stimulation of the plasmonic resonance. Compared to the conventional fiber plasmonic resonance sensor, the initial resonance dip (the resonance dip corresponding to the RI of the pure water i.e., 1.3332) of the NMF-CPR sensor exhibits blueshift and narrowing. As the thickness of the Au layer increases, the initial resonance dip exhibits redshift, the FWHM becomes large, and the average sensitivity of the sensor increases and is higher than that of the conventional fiber plasmonic resonance sensor. However, when the thickness of the Au layer is close to or larger than the penetration depth (on the order of hundreds of nanometers41) of the evanescent field generated by the incident light in the fiber, SPPs cannot be formed on the upper surface of the Au layer. The sensor will no longer be able to detect the RI change in the sample. Above results achieve a good agreement with numerical simulations. The FOM (26.79 RIU–1) of the NMF-CPR sensor with a WSe2 layer of 10 nm and an Au layer of 50 nm is 1.39 times higher than that (19.34 RIU–1) of the conventional fiber plasmonic resonance sensor with an Au layer of 50 nm.

    (a) Initial resonance dips of NMF-CPR sensors with different thicknesses of Au layers. Inset: binomial fitting curves of resonance wavelengths and RI points. The tangent slope of each point on the curve represents the sensitivity of the sensor at the corresponding RI point. (b) The sensitivity of NMF-CPR sensors with different thicknesses of Au layers corresponding to each RI. Inset: the sensitivity of conventional fiber plasmonic resonance sensors with different thicknesses of Au layers.

    Figure 5.(a) Initial resonance dips of NMF-CPR sensors with different thicknesses of Au layers. Inset: binomial fitting curves of resonance wavelengths and RI points. The tangent slope of each point on the curve represents the sensitivity of the sensor at the corresponding RI point. (b) The sensitivity of NMF-CPR sensors with different thicknesses of Au layers corresponding to each RI. Inset: the sensitivity of conventional fiber plasmonic resonance sensors with different thicknesses of Au layers.

    Table Infomation Is Not Enable

    It can also be found that as the external RI increases, the sensitivity of the sensor is improved. This is because the RI matching degree between the nano-modified fiber core and the sample layer is enhanced due to the increment of the RI of the sample layer. When the RI of the sample layer is close to that of the modified fiber core, a symmetric plasmonic resonance excitation configuration is generated on both sides of the Au layer58. In the meantime, the attenuation of SPPs is decreased and the electric field intensity of SPPs is enhanced. This results in a larger electric field penetration depth and a longer propagation distance of SPPs58. The sensor will thus have the capability to detect a smaller change in the RI of the sample, i.e., the sensitivity of the sensor is enhanced. A reported FEA work59 has shown that the sensitivity of the sensor can achieve as high as 5673 nm/RIU when the external refractive index reaches a range of 1.37–1.40 which is close to that (600 nm, 1.458048) of the silica fiber core. Meanwhile, Eq. (5) is a concave function, as seen in Fig. 1(d). The tangent slope of each point on the curve represents the sensitivity of the sensor at the corresponding RI point, and is improved with the increment of the RI. This supports the above discussion.

    Tip hot spot enhanced NMF-CPR sensor

    The scattering of the light by AuNSs will increase the FWHM of the sensor and will reduce the detection accuracy60. The sensitivity of the NMF-CPR sensor with a WSe2 layer of 10 nm and an Au layer of 50 nm is relatively high, and its FWHM is moderate. Therefore, the thickness of the Au layer in the tip hot spot enhanced NMF-CPR sensor is 50 nm. Spectral characteristics of sensors with different volume proportions of WSe2 and AuNSs (WSe2∶AuNSs) are investigated. As shown in Fig. 6(a–c) and Fig. S7, with the increment of the doping proportion of AuNSs, the resonance dip of the sensor exhibits redshift and broadening. The sensitivity and the FOM of the sensor can achieve up to 2995.70 nm/RIU and 25.04 RIU–1, respectively, which are 1.68 times and 1.29 times higher than those (1787.93 nm/RIU and 19.34 RIU–1) of the conventional fiber plasmonic resonance sensor with an Au layer of 50 nm, respectively. When the doping proportion is 3∶1, the FOM of the sensor is not enhanced obviously but the FWHM is significantly broadened. Therefore, 3∶1 is the optimum doping proportion. Although the FWHM of the tip hot spot enhanced NMF-CPR sensor is larger than that of the conventional fiber plasmonic resonance sensor, the resonance wavelength of the tip hot spot enhanced NMF-CPR sensor can still be accurately demodulated, as shown in Fig. 6(d). The wavelength resolution in the demodulation system is considered as the three-fold standard deviation of the resonance wavelength, as seen in Fig. 6(d). The detection resolution of the sensor is calculated by dividing the wavelength resolution (3σ=0.06 nm) by the average sensitivity (2995.70 nm/RIU)61, and it reaches up to 2.00×10⁻⁵ RIU. For the same plasmonic resonance sensor, the sensitivity in different external RI ranges is distinctly different62. The sensitivity corresponding to an external RI range close to the RI of the substrate is higher than that corresponding to other RI ranges62. Therefore, the reported research works on the RI sensing in similar RI ranges using fiber plasmonic resonance sensors have been listed in Table 3. The comparison shows that the sensitivity of the tip hot spot enhanced NMF-CPR sensor in this work is slightly higher than that in ref.63 but is obviously higher than those in refs.64-68. The detection resolution of the sensor is approximately one order of magnitude higher than those (1.25×10⁻⁴ RIU, 2.16×10⁻⁴ RIU and 9.60×10⁻⁵ RIU, the wavelength resolution of the spectrometer is 0.27 nm) reported in ref.63. This indicates that the sensitivity of the sensor is improved while the sensor still has a high detection accuracy. Furthermore, the reflective sensing structure in this work allows lower cost, simpler fabrication and more convenient operation.

    (a) Initial resonance dips of tip hot spot enhanced NMF-CPR sensors with different doping proportions (WSe2∶AuNSs). Inset: resonance spectra of the sensor with a doping proportion of 3∶1. (b) The sensitivity of tip hot spot enhanced NMF-CPR sensors with different doping proportions corresponding to each RI. The average sensitivity of the sensors is 2142.07 nm/RIU, 2492.58 nm/RIU and 2995.70 nm/RIU, respectively. Inset: binomial fitting curves of resonance wavelengths and RI points. The tangent slope of each point on the curve represents the sensitivity of the sensor at the corresponding RI point. (c) The FWHM of initial resonance dips and the FOM of the sensors with different doping proportions. (d) Monitoring of the resonance wavelength of the tip hot spot enhanced NMF-CPR sensor with a doping proportion of 3∶1.

    Figure 6.(a) Initial resonance dips of tip hot spot enhanced NMF-CPR sensors with different doping proportions (WSe2∶AuNSs). Inset: resonance spectra of the sensor with a doping proportion of 3∶1. (b) The sensitivity of tip hot spot enhanced NMF-CPR sensors with different doping proportions corresponding to each RI. The average sensitivity of the sensors is 2142.07 nm/RIU, 2492.58 nm/RIU and 2995.70 nm/RIU, respectively. Inset: binomial fitting curves of resonance wavelengths and RI points. The tangent slope of each point on the curve represents the sensitivity of the sensor at the corresponding RI point. (c) The FWHM of initial resonance dips and the FOM of the sensors with different doping proportions. (d) Monitoring of the resonance wavelength of the tip hot spot enhanced NMF-CPR sensor with a doping proportion of 3∶1.

    Table Infomation Is Not Enable

    Additionally, the stability of the tip hot spot enhanced NMF-CPR sensor is investigated. Coating the dielectric layer on the upper surface of the plasmonic resonance sensor will cause the dielectric nanomaterials to easily fall off during the detection of liquid samples, which will lead to the change of the resonance wavelength and will reduce the stability of the sensor. The intermediate layer is under the Au layer in the tip hot spot enhanced NMF-CPR sensor in this work. The dense Au layer can avoid the shedding and the denaturation of the intermediate layer. The sensor has been used to detect pure water for 15 minutes, and the resonance wavelength is kept within in a stable range, as shown in Fig. 6(d). This manifests that the sensor possesses excellent stability.

    Conclusions

    A dispersion model is developed to provide a general principle for the customized design of the plasmonic resonance curve according to specific detection requirements. According to the model, a tip hot spot enhanced reflective NMF-CPR sensor is proposed and applied to the measurement of the RI in a low range. Firstly, spectral characteristics of the NMF-CPR sensors are simulated based on the FEA. It is shown that the sensitivity and the FOM of the tip hot spot enhanced NMF-CPR sensor reach 3200.11 nm/RIU and 36.14 RIU–1, respectively, which are increased by 77.78% and 46.26% compared to those of the conventional fiber plasmonic resonance sensor. Secondly, the tip hot spot enhanced NMF-CPR sensor is practically implemented. Experimental results show that the sensitivity and the FOM of the sensor reach 2995.70 nm/RIU and 25.04 RIU–1, respectively, which are increased by 67.55% and 29.47% compared to those of the conventional fiber plasmonic resonance sensor. Thirdly, the wavelength resolution in the demodulation system and the detection resolution of the tip hot spot enhanced NMF-CPR sensor are up to 0.02 nm and 2.00×10⁻⁵ RIU, respectively. This suggests that the sensor still has a high detection accuracy while the sensitivity is significantly improved. Furthermore, the dense and uniform Au layer directly detects the sample, which avoids the drift of the resonance dip caused by the shedding of the modified nanomaterials. This thereby improves the stability of the sensor. The proposed sensor also provides better performance and easier operation compared to the reported works. The developed sensor in this work can be used as a highly sensitive refractometer and shows promising prospects for future applications in the scenarios of disease early screening, food safety detection and marine environmental monitoring.

    Materials and methods

    Materials and reagents

    The multimode fiber with a 600-µm silica core and 630-µm plastic cladding, and a numerical aperture of 0.37 is purchased from Yangtze Optical Fibre and Cable Joint Stock Corp., Ltd. Wuhan, China. Hydrogen peroxide (H2O2, 30% wt.%), concentrated sulfuric acid (H2SO4, 98% wt.%) and Poly(diallyldimethylammonium chloride) (PDDA, 20 wt.%) are purchased from Aladdin Corp., Ltd. Shanghai, China. WSe2 nanosheets dispersion (1 layer–10 layers, lateral size: 50 nm–1000 nm, 0.5 mg/mL) and AuNSs dispersion (diameter: 40 nm–45 nm, 0.1 mg/mL) are purchased from Nanjing 2DNANO Tech. Corp., Ltd. Nanjing, China.

    Fabrication of the NMF-CPR sensor

    An endpoint-reflective fiber structure, that allows dual stimulation of the plasmonic resonance (stimulated by the incident light and the reflected light, respectively) and convenient detection, is used to construct sensors. The cladding at the ends of the fiber is removed as shown in Fig. S8(a-i), and the reflection area is separated from the sensing area to avoid the interference. A grinder has been utilized to grind the end face of the fiber into a plane, as shown in Fig. S9(a). An Ag layer of 200 nm is used as the reflector due to its higher reflectance (in Fig. S9(b)), and is sputtered on the reflection area followed by sputtering an Au layer of 5 nm to avoid the oxidation of the Ag layer, as shown in Fig. S8(a-ii). The sputtering of metal layers is achieved by a magnetron sputtering apparatus (MSP-3200, Shenyang LiNing Institute of Vacuum Technology, Shenyang, China). The thicknesses of metal layers are controlled by the crystal-calibrated sputtering rate and the sputtering time. A single Au layer is sputtered on the sensing area to complete the fabrication of the conventional fiber plasmonic resonance sensor. Figure S9(c) and S9(d) indicate that the Au layer is dense, uniform and smooth.

    The sensing area is immersed in the piranha solution (H2O2∶H2SO4= 1∶3, v/v) for 30 minutes to complete surface hydroxylation and then immersed in 1 mg/mL PDDA solution for 30 minutes to make the area positively charged. A flat, dense and uniform WSe2 layer is the key factor to obtain the high-quality plasmonic resonance. Otherwise, the non-uniform WSe2 flakes will increase the radiation damping of SPPs and will thereby broaden the FWHM of the resonance curve. Therefore, the ultrasonic treatment of WSe2 nanosheets is required to guarantee the nanosheets to have a smaller and uniform size for better film-forming quality. As shown in Fig. S10(a) and S10(b), sizes of ultrasonic-dispersed WSe2 nanosheets are in the order of hundreds of nanometers, and nanosheets are negatively charged. The sensing area is immersed in WSe2 dispersion for 60 minutes, and the WSe2 nanosheets can be evenly attached to the surface of the area under the adsorption of positive and negative charges, as shown in Fig. S8(a-iii). The sensing area is rinsed with deionized water to remove the unattached WSe2 and then dried. Due to the saturation of the electrostatic adsorption, the thickness of the WSe2 layer can only be roughly adjusted in a small range around 10 nm by controlling the immersion time. Therefore, NMF-CPR sensors with WSe2 layers of approximately 10 nm have been developed in this work. An Au layer is sputtered on the surface of the WSe2-coated sensing area to complete the fabrication of the NMF-CPR sensor, as shown in Fig. S8(a-iv). The realistic image of the NMF-CPR sensor is shown in Fig. S8(b-i). The scanning electron microscope (SEM) images of the surface and the cross section of the sensing area of the NMF-CPR sensor with a WSe2 layer of approximately 10 nm and an Au layer of approximately 50 nm are shown in Fig. S10(c) and S10(d).

    Fabrication of the tip hot spot enhanced NMF-CPR sensor

    The fabrication of the tip hot spot enhanced NMF-CPR sensor is similar to that of the NMF-CPR sensor, as shown in Fig. S8(a-iii) and S8(a-iv). Figure S11(a) and S11(b) indicate that sizes of AuNSs are in the order of tens of nanometers which is smaller than those of WSe2 nanosheets, and AuNSs are positively charged. AuNSs can be evenly attached to the surface of negatively charged WSe2 nanosheets, and there are still a large number of hydroxyl groups in the mixture of WSe2 nanosheets and AuNSs (WSe2@AuNSs), as shown in Fig. S11(c) and S11(d). Therefore, the WSe2@AuNSs can also be attached to the PDDA functionalized fiber surface. The realistic image of the tip hot spot enhanced NMF-CPR sensor is shown in Fig. S8(b-ii). Specific fabrication processes of sensors are shown in Fig. S12.

    Demodulation system

    The demodulation system for the RI measurement is shown in Fig. S13. The light emitted from the light source (DH-2000, Ocean Insight, Inc. Florida, USA) enters the fiber optic sensor through a Y-type fiber patch cord. Then the light is reflected by the Ag reflector, and is collected by the spectrometer (Maya2000 Pro, Ocean Insight, Inc. Florida, USA). The insertion of the sensor into RI solutions prepared by glycerol and the withdrawal are controlled by a dip coater (SYDC-100, Shanghai SanYan Technology Corp., Ltd. Shanghai, China). The spectral signal is processed by the all-phase low-pass filtering algorithm69, and the resonance wavelength is interrogated by the weighted wavelength algorithm70 in a real-time manner, as shown in Fig. S14. The experiment for the measurement of the RI is carried out at a constant room temperature of 25 °C to exclude the influence of the temperature disturbance on the detection accuracy of the sensor.

    References

    [1] T Liu, H Li, T He, CZ Fan, ZJ Yan et al. Ultra-high resolution strain sensor network assisted with an LS-SVM based hysteresis model. Opto-Electron Adv, 4, 200037(2021).

    [2] BO Guan, L Jin, J Ma, YZ Liang, X Bai. Flexible fiber-laser ultrasound sensor for multiscale photoacoustic imaging. Opto-Electron Adv, 4, 200081(2021).

    [3] RL Wang, HZ Zhang, QY Liu, F Liu, XL Han et al. Operando monitoring of ion activities in aqueous batteries with plasmonic fiber-optic sensors. Nat Commun, 13, 547(2022).

    [4] C Caucheteur, T Guo, F Liu, BO Guan, J Albert. Ultrasensitive plasmonic sensing in air using optical fibre spectral combs. Nat Commun, 7, 13371(2016).

    [5] C Lee, B Lawrie, R Pooser, KG Lee, C Rockstuhl et al. Quantum plasmonic sensors. Chem Rev, 121, 4743-4804(2021).

    [6] Y Liu, W Peng. Fiber-optic surface Plasmon resonance sensors and biochemical applications: a review. J Lightwave Technol, 39, 3781-3791(2021).

    [7] Y Zhao, RJ Tong, F Xia, Y Peng. Current status of optical fiber biosensor based on surface Plasmon resonance. Biosens Bioelectron, 142, 111505(2019).

    [8] JY Jing, K Liu, JF Jiang, TH Xu, S Wang et al. Performance improvement approaches for optical fiber SPR sensors and their sensing applications. Photonics Res, 10, 126-147(2022).

    [9] Y Singh, SK Raghuwanshi. Titanium dioxide (TiO2) coated optical fiber-based SPR sensor in near-infrared region with bimetallic structure for enhanced sensitivity. Optik, 226, 165842(2021).

    [10] LK Li, YN Zhang, YF Zhou, WL Zheng, YT Sun et al. Optical fiber optofluidic bio-chemical sensors: a review. Laser Photonics Rev, 15, 2000526(2021).

    [11] R Singh, S Kumar, FZ Liu, C Shuang, BY Zhang et al. Etched multicore fiber sensor using copper oxide and gold nanoparticles decorated graphene oxide structure for cancer cells detection. Biosens Bioelectron, 168, 112557(2020).

    [12] GY Wang, Y Lu, LC Duan, JQ Yao. A refractive index sensor based on PCF with ultra-wide detection range. IEEE J Sel Top Quant, 27, 5600108(2021).

    [13] A Urrutia, Villar I Del, P Zubiate, CR Zamarreño. A comprehensive review of optical fiber refractometers: toward a standard comparative criterion. Laser Photonics Rev, 13, 1900094(2019).

    [14] LH Liu, XJ Zhang, Q Zhu, KW Li, Y Lu et al. Ultrasensitive detection of endocrine disruptors via superfine plasmonic spectral combs. Light Sci Appl, 10, 181(2021).

    [15] SJ Weng, L Pei, JS Wang, TG Ning, J Li. High sensitivity D-shaped hole fiber temperature sensor based on surface Plasmon resonance with liquid filling. Photonics Res, 5, 103-107(2017).

    [16] D Wang, W Li, QR Zhang, BQ Liang, ZK Peng et al. High-performance tapered fiber surface Plasmon resonance sensor based on the graphene/Ag/TiO2 layer. Plasmonics, 16, 2291-2303(2021).

    [17] H Song, Q Wang, WM Zhao. A novel SPR sensor sensitivity-enhancing method for immunoassay by inserting MoS2 nanosheets between metal film and fiber. Opt Laser Eng, 132, 106135(2020).

    [18] JY Jing, K Liu, JF Jiang, TH Xu, S Wang et al. Double-antibody sandwich immunoassay and plasmonic coupling synergistically improved long-range SPR biosensor with low detection limit. Nanomaterials, 11, 2137(2021).

    [19] FC Chien, SJ Chen. A sensitivity comparison of optical biosensors based on four different surface Plasmon resonance modes. Biosens Bioelectron, 20, 633-642(2004).

    [20] S Jain, A Paliwal, V Gupta, M Tomar. Smartphone integrated handheld Long Range Surface Plasmon Resonance based fiber-optic biosensor with tunable SiO2 sensing matrix. Biosens Bioelectron, 201, 113919(2022).

    [21] AM Shrivastav, L Satish, A Kushmaro, V Shvalya, U Cvelbar et al. Engineering the penetration depth of nearly guided wave surface Plasmon resonance towards application in bacterial cells monitoring. Sensor Actuators B:Chem, 345, 130338(2021).

    [22] XD Jiang, WR Xu, N Ilyas, MC Li, RK Guo et al. High-Performance coupled Plasmon waveguide resonance optical sensor based on SiO2: Ag film. Results Phys, 26, 104308(2021).

    [23] JY Ma, K Liu, JF Jiang, TH Xu, S Wang et al. All optic-fiber coupled Plasmon waveguide resonance sensor using ZrS2 based dielectric layer. Opt Express, 28, 11280-11289(2020).

    [24] LT Ji, SQ Yang, RN Shi, YJ Fu, J Su et al. Polymer waveguide coupled surface Plasmon refractive index sensor: a theoretical study. Photonic Sens, 10, 353-363(2020).

    [25] MB Ross, JC Ku, B Lee, CA Mirkin, GC Schatz. Plasmonic metallurgy enabled by DNA. Adv Mater, 28, 2790-2794(2016).

    [26] WJ Zhang, XL Zeng, A Yang, LP Teng, Y Zhu. Research on evanescent field ammonia detection with gold-nanosphere coated microfibers. Opto-Electron Eng, 48, 200451(2021).

    [27] JY Jing, Q Zhu, ZX Dai, SY Li, Q Wang et al. Sensing self-referenced fiber optic long-range surface Plasmon resonance sensor based on electronic coupling between surface Plasmon polaritons. Appl Opt, 58, 6329-6334(2019).

    [28] YL Yang, HJ Chen, XX Zou, XL Shi, WD Liu et al. Flexible carbon-fiber/semimetal Bi nanosheet arrays as separable and recyclable plasmonic photocatalysts and photoelectrocatalysts. ACS Appl Mater Interfaces, 12, 24845-24854(2020).

    [29] AV Kabashin, P Evans, S Pastkovsky, W Hendren, GA Wurtz et al. Plasmonic nanorod metamaterials for biosensing. Nat Mater, 8, 867-871(2009).

    [30] R Kant, R Tabassum, BD Gupta. Xanthine oxidase functionalized Ta2O5 nanostructures as a novel scaffold for highly sensitive SPR based fiber optic xanthine sensor. Biosens Bioelectron, 99, 637-645(2018).

    [31] JN Chen, M Badioli, P Alonso-González, S Thongrattanasiri, F Huth et al. Optical nano-imaging of gate-tunable graphene plasmons. Nature, 487, 77-81(2012).

    [32] Y Singh, MK Paswan, SK Raghuwanshi. Sensitivity enhancement of SPR sensor with the black phosphorus and graphene with Bi-layer of gold for chemical sensing. Plasmonics, 16, 1781-1790(2021).

    [33] LX Liu, K Ye, ZY Jia, TY Xue, AM Nie et al. High-sensitivity and versatile plasmonic biosensor based on grain boundaries in polycrystalline 1L WS2 films. Biosens Bioelectron, 194, 113596(2021).

    [34] Q Wu, NB Li, Y Wang, YC Xu, JD Wu et al. Ultrasensitive and selective determination of carcinoembryonic antigen using multifunctional ultrathin amino-functionalized Ti3C2-MXene nanosheets. Anal Chem, 92, 3354-3360(2020).

    [35] S Yang, W Bao, XZ Liu, J Kim, RK Zhao et al. Subwavelength-scale lasing perovskite with ultrahigh Purcell enhancement. Matter, 4, 4042-4050(2021).

    [36] A Shalabney, I Abdulhalim. Sensitivity-enhancement methods for surface Plasmon sensors. Laser Photonics Rev, 5, 571-606(2011).

    [37] Y Zhao, M Lei, SX Liu, Q Zhao. Smart hydrogel-based optical fiber SPR sensor for pH measurements. Sensor Actuators B:Chem, 261, 226-232(2018).

    [38] ZH Zhao, Q Wang. Gold nanoparticles (AuNPs) and graphene oxide heterostructures with gold film coupling for an enhanced sensitivity surface Plasmon resonance (SPR) fiber sensor. Instrum Sci Technol, 50, 530-542(2022).

    [39] VG Kravets, AV Kabashin, WL Barnes, AN Grigorenko. Plasmonic surface lattice resonances: a review of properties and applications. Chem Rev, 118, 5912-5951(2018).

    [40] S Shi, LB Wang, RX Su, BS Liu, RL Huang et al. A polydopamine-modified optical fiber SPR biosensor using electroless-plated gold films for immunoassays. Biosens Bioelectron, 74, 454-460(2015).

    [41] F Chiavaioli, CAJ Gouveia, PAS Jorge, F Baldini. Towards a uniform metrological assessment of grating-based optical fiber sensors: from refractometers to biosensors. Biosensors, 7, 23(2017).

    [42] XZ Zhang, BY Yang, JF Jiang, K Liu, XJ Fan et al. Side-polished SMS based RI sensor employing macro-bending perfluorinated POF. Opto-Electron Adv, 4, 200041(2021).

    [43] B Dastmalchi, P Tassin, T Koschny, CM Soukoulis. A new perspective on plasmonics: confinement and propagation length of surface plasmons for different materials and geometries. Adv Opt Mater, 4, 177-184(2016).

    [44] WL Zheng, YN Zhang, LK Li, XG Li, Y Zhao. A plug-and-play optical fiber SPR sensor for simultaneous measurement of glucose and cholesterol concentrations. Biosens Bioelectron, 198, 113798(2022).

    [45] C Ciracì, RT Hill, JJ Mock, Y Urzhumov, AI Fernández-Domínguez et al. Probing the ultimate limits of plasmonic enhancement. Science, 337, 1072-1074(2012).

    [46] Y Vasimalla, HS Pradhan, RJ Pandya. SPR performance enhancement for DNA hybridization employing black phosphorus, silver, and silicon. Appl Opt, 59, 7299-7307(2020).

    [47] HG Gu, BK Song, MS Fang, YL Hong, XG Chen et al. Layer-dependent dielectric and optical properties of centimeter-scale 2D WSe2: evolution from a single layer to few layers. Nanoscale, 11, 22762-22771(2019).

    [48] IH Malitson. Interspecimen comparison of the refractive index of fused silica. J Opt Soc Am, 55, 1205-1209(1965).

    [49] M Krüger, M Schenk, P Hommelhoff. Attosecond control of electrons emitted from a nanoscale metal tip. Nature, 475, 78-81(2011).

    [50] Q Chen, L Liang, QL Zheng, YX Zhang, L Wen. On-chip readout plasmonic mid-IR gas sensor. Opto-Electron Adv, 3, 190040(2020).

    [51] Q Wu, Y Sun, D Zhang, S Li, Y Zhang et al. Ultrasensitive magnetic field-assisted surface Plasmon resonance immunoassay for human cardiac troponin I. Biosens Bioelectron, 96, 288-293(2017).

    [52] JS Jensen, O Sigmund. Topology optimization for Nano-photonics. Laser Photonics Rev, 5, 308-321(2011).

    [53] M Xue, K Liu, T Wang, PX Chang, JF Jiang et al. Single mode fiber SPR refractive index sensor based on U-shaped structure. Acta Photonica Sin, 46, 1006004(2017).

    [54] EM You, YQ Chen, J Yi, ZD Meng, Q Chen et al. Nanobridged rhombic antennas supporting both dipolar and high-order plasmonic modes with spatially superimposed hotspots in the mid-infrared. Opto-Electron Adv, 4, 210076(2021).

    [55] TS Wu, Y Shao, Y Wang, SQ Cao, WP Cao et al. Surface Plasmon resonance biosensor based on gold-coated side-polished hexagonal structure photonic crystal fiber. Opt Express, 25, 20313-20322(2017).

    [56] Y Shen, JH Zhou, TR Liu, YT Tao, RB Jiang et al. Plasmonic gold mushroom arrays with refractive index sensing figures of merit approaching the theoretical limit. Nat Commun, 4, 2381(2013).

    [57] WQ Zhu, R Esteban, AG Borisov, JJ Baumberg, P Nordlander et al. Quantum mechanical effects in plasmonic structures with subnanometre gaps. Nat Commun, 7, 11495(2016).

    [58] J Homola. Surface Plasmon resonance sensors for detection of chemical and biological species. Chem Rev, 108, 462-493(2008).

    [59] XM Wang, CL Zhao, YR Wang, SZ Jin. A proposal of T-structure fiber-optic refractive index sensor based on surface Plasmon resonance. Opt Commun, 369, 189-193(2016).

    [60] H Harutyunyan, ABF Martinson, D Rosenmann, LK Khorashad, LV Besteiro et al. Anomalous ultrafast dynamics of hot plasmonic electrons in nanostructures with hot spots. Nat Nanotechnol, 10, 770-774(2015).

    [61] GQ Wang, KQ Wang, J Ren, S Ma, ZH Li. A novel doublet-based surface Plasmon resonance biosensor via a digital Gaussian filter method. Sensor Actuators B:Chem, 360, 131680(2022).

    [62] Q Wang, JY Jing, WM Zhao, XC Fan, XZ Wang. A novel fiber-based symmetrical long-range surface Plasmon resonance biosensor with high quality factor and temperature self-reference. IEEE Trans Nanotechnol, 18, 1137-1143(2019).

    [63] R Zakaria, NM Zainuddin, MASA Fahri, PM Thirunavakkarasu, SK Patel et al. High sensitivity refractive index sensor in long-range surface Plasmon resonance based on side polished optical fiber. Opt Fiber Technol, 61, 102449(2021).

    [64] DL Hou, XX Ji, NN Luan, L Song, YS Hu et al. Surface Plasmon resonance sensor based on double-sided polished microstructured optical fiber with hollow core. IEEE Photonics J, 13, 6800408(2021).

    [65] R Zakaria, NAM Zainuddin, SA Raya, SAK Alwi, T Anwar et al. Sensitivity comparison of refractive index transducer optical fiber based on surface Plasmon resonance using Ag, Cu, and bimetallic Ag-Cu layer. Micromachines, 11, 77(2020).

    [66] NAM Zainuddin, MM Ariannejad, PT Arasu, SW Harun, R Zakaria. Investigation of cladding thicknesses on silver SPR based side-polished optical fiber refractive-index sensor. Results Phys, 13, 102255(2019).

    [67] IS Amiri, SAK Alwi, SA Raya, NAM Zainuddin, NS Rohizat et al. Graphene oxide effect on improvement of silver surface Plasmon resonance D-shaped optical fiber sensor. J Opt Commun. https://doi.org/10.1515/joc-2019-0094

    [68] N Cennamo, D Massarotti, L Conte, L Zeni. Low cost sensors based on SPR in a plastic optical fiber for biosensor implementation. Sensors, 11, 11752-11760(2011).

    [69] YZ Cao, JY Ma, K Liu, XD Huang, JF Jiang et al. Optical fiber SPR sensing demodulation algorithm based on all-phase filters. Acta Phys Sin, 66, 074202(2017).

    [70] WC Jing, GH Wang, K Liu, YM Zhang, H Dong et al. Application of weighted wavelength algorithm on the demodulation of a fiber Bragg grating optical sensing system. J Optoelectron·Laser, 18, 1022-1025(2007).

    Jianying Jing, Kun Liu, Junfeng Jiang, Tianhua Xu, Shuang Wang, Tiegen Liu. Highly sensitive and stable probe refractometer based on configurable plasmonic resonance with nano-modified fiber core[J]. Opto-Electronic Advances, 2023, 6(6): 220072
    Download Citation