• Photonics Research
  • Vol. 10, Issue 3, 637 (2022)
Krishna Murari1、2、3、*, Giovanni Cirmi1、4, Hüseyin Cankaya1、4, Gregory J. Stein1, Benoit Debord5, Frederic Gérôme5, Felix Ritzkosky1, Fetah Benabid5, Oliver Muecke1、3, and Franz X. Kärtner1、2、4
Author Affiliations
  • 1Center for Free Electron Laser Science CFEL, Deutsches Elektronen-Synchrotron DESY, 22607 Hamburg, Germany
  • 2Max-Planck Institute for Structure and Dynamics of Matter (MPSD), 22761 Hamburg, Germany
  • 3ELI-ALPS, ELI-HU Non-Profit Ltd., Szeged H-6728, Hungary
  • 4The Hamburg Center for Ultrafast Imaging & Department of Physics, University of Hamburg, 22761 Hamburg, Germany
  • 5GPPMM Group, XLIM Research Institute, UMR 7252 CNRS, University of Limoges, Limoges, France
  • show less
    DOI: 10.1364/PRJ.441674 Cite this Article Set citation alerts
    Krishna Murari, Giovanni Cirmi, Hüseyin Cankaya, Gregory J. Stein, Benoit Debord, Frederic Gérôme, Felix Ritzkosky, Fetah Benabid, Oliver Muecke, Franz X. Kärtner. Sub-50 fs pulses at 2050 nm from a picosecond Ho:YLF laser using a two-stage Kagome-fiber-based compressor[J]. Photonics Research, 2022, 10(3): 637 Copy Citation Text show less
    Proposed scheme of two-color HHG driven by Ho-CPA as front-end.
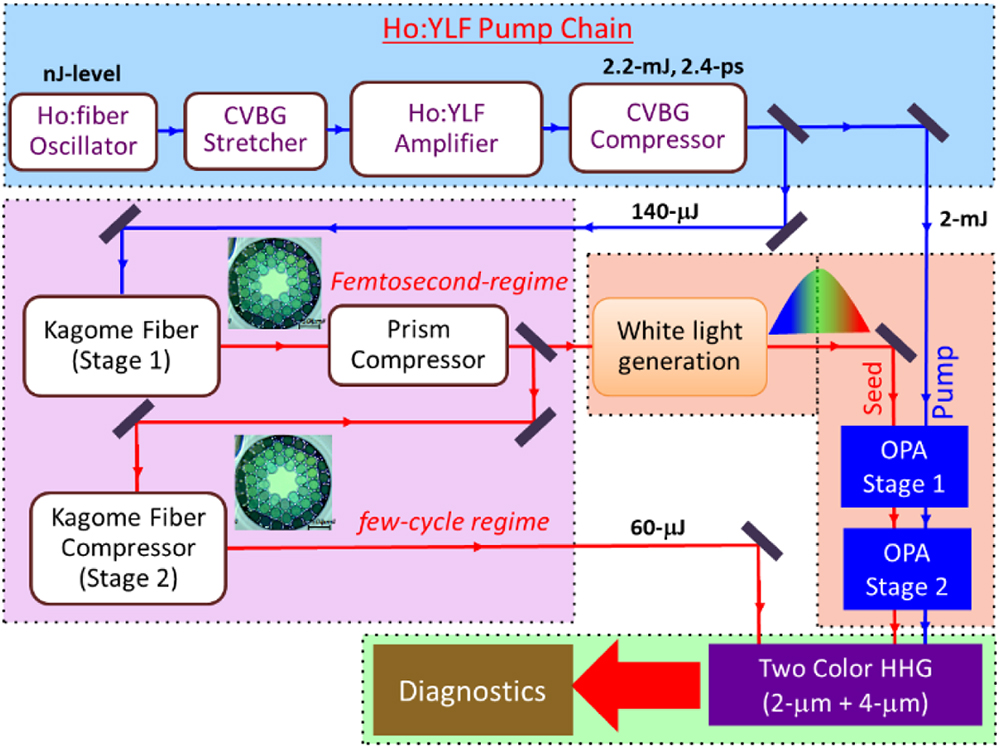
    Fig. 1. Proposed scheme of two-color HHG driven by Ho-CPA as front-end.
    (a) The schematic layout of the Ho-CPA based on Ho:fiber oscillator, amplifier, and chirp volume Bragg grating (CVBG)-based stretcher and compressor with half-wave plate (λ/2), quarter-wave plate (λ/4), and thin-film polarizer (TFP). (b) The principle of intracavity gain shaping using an etalon in the amplifier: the etalon transmission (blue) aligned with the gain spectrum (black) that yields effectively broader net gain spectrum (red).
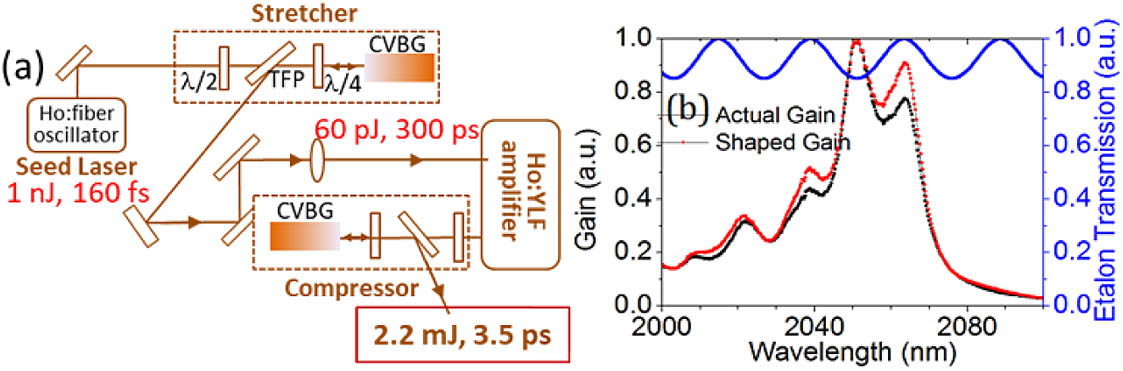
    Fig. 2. (a) The schematic layout of the Ho-CPA based on Ho:fiber oscillator, amplifier, and chirp volume Bragg grating (CVBG)-based stretcher and compressor with half-wave plate (λ/2), quarter-wave plate (λ/4), and thin-film polarizer (TFP). (b) The principle of intracavity gain shaping using an etalon in the amplifier: the etalon transmission (blue) aligned with the gain spectrum (black) that yields effectively broader net gain spectrum (red).
    Measured spectral evolution at the output of the Ar-gas filled 19-cell Kagome fiber at a pressure of 3 bar with an increasing input energy at a pulse duration of 3.3 ps (left) and 1.8 ps (right).
    Fig. 3. Measured spectral evolution at the output of the Ar-gas filled 19-cell Kagome fiber at a pressure of 3 bar with an increasing input energy at a pulse duration of 3.3 ps (left) and 1.8 ps (right).
    Experimental layout of the two-stage compression in 7-cell Kagome fiber: the first stage comprises spectral broadening in the fiber of length 3 m and a prism compressor whose tip-to-tip separation is 1.1 m. The output of the first stage is launched in the second piece of Kagome fiber and self-compressed with the outer end placed in the gas cell. The GDD of the thin window of the gas cell is used to compensate for the small positive chirp remaining in the fiber.
    Fig. 4. Experimental layout of the two-stage compression in 7-cell Kagome fiber: the first stage comprises spectral broadening in the fiber of length 3 m and a prism compressor whose tip-to-tip separation is 1.1 m. The output of the first stage is launched in the second piece of Kagome fiber and self-compressed with the outer end placed in the gas cell. The GDD of the thin window of the gas cell is used to compensate for the small positive chirp remaining in the fiber.
    (a) Measured spectral evolution obtained at the output of the second stage with increasing input pulse energy for three different gas conditions in the fiber: air at 1 atm pressure; Kr gas filled in the fiber at a pressure of 3, 4, and 5 bar. (b) Measured autocorrelation trace at the input of the first stage (red), input of the second stage (blue), output of the second stage (highlighted background) with different amount of negative GDD added to optimize the remaining chirp from the second stage fiber compressor.
    Fig. 5. (a) Measured spectral evolution obtained at the output of the second stage with increasing input pulse energy for three different gas conditions in the fiber: air at 1 atm pressure; Kr gas filled in the fiber at a pressure of 3, 4, and 5 bar. (b) Measured autocorrelation trace at the input of the first stage (red), input of the second stage (blue), output of the second stage (highlighted background) with different amount of negative GDD added to optimize the remaining chirp from the second stage fiber compressor.
    FROG results of output pulse from the second stage based on 7-cell Kagome fiber of length 2 m filled with air. (a) Measured FROG trace shown on the full time scale; (b) FROG trace after filtering out the compressed part using a super-Gaussian filter in the time domain; (c) reconstructed FROG trace retrieved from the filtered trace; (d) measured (red) and retrieved (black) spectrum with the retrieved spectral phase in blue; (e) retrieved temporal profile (black) and retrieved temporal phase (blue) overlaid with the simulated profile in the green dotted line.
    Fig. 6. FROG results of output pulse from the second stage based on 7-cell Kagome fiber of length 2 m filled with air. (a) Measured FROG trace shown on the full time scale; (b) FROG trace after filtering out the compressed part using a super-Gaussian filter in the time domain; (c) reconstructed FROG trace retrieved from the filtered trace; (d) measured (red) and retrieved (black) spectrum with the retrieved spectral phase in blue; (e) retrieved temporal profile (black) and retrieved temporal phase (blue) overlaid with the simulated profile in the green dotted line.
    (a) Measured pulse-to-pulse fluctuations for 70 min at the output of the Ho-CPA (black) and after the second stage compression (red); (b) measured output spectra from the amplifier (black), after compression from the first stage Kagome fiber (red) and from the second stage Kagome fiber (blue).
    Fig. 7. (a) Measured pulse-to-pulse fluctuations for 70 min at the output of the Ho-CPA (black) and after the second stage compression (red); (b) measured output spectra from the amplifier (black), after compression from the first stage Kagome fiber (red) and from the second stage Kagome fiber (blue).
    Simulation results after the second stage with a fiber length of 2 m and input pulse parameters obtained from the output of the first stage. (a) Spectral evolution along the fiber length; (b) temporal evolution along the fiber length, the white dashed line indicates the pulse exit point from the fiber; (c) simulated spectrum (red); (d) simulated temporal profile (red) obtained at the end of the fiber length, overlaid with the experimental profile (black).
    Fig. 8. Simulation results after the second stage with a fiber length of 2 m and input pulse parameters obtained from the output of the first stage. (a) Spectral evolution along the fiber length; (b) temporal evolution along the fiber length, the white dashed line indicates the pulse exit point from the fiber; (c) simulated spectrum (red); (d) simulated temporal profile (red) obtained at the end of the fiber length, overlaid with the experimental profile (black).
    White light generation in a thin YAG plate with pulses derived from the two-stage Kagome compressor for different input energies. The top panel shows the schematic of white light generation setup.
    Fig. 9. White light generation in a thin YAG plate with pulses derived from the two-stage Kagome compressor for different input energies. The top panel shows the schematic of white light generation setup.
    τ (fs)LD (m)Argon-5 barKrypton-5 barAir-1 atm
    LNL (m)NLNL (m)NLNL (m)N
    330046440.261340.082391.6254
    180013820.14990.041760.8840
    285350.03320.01560.2213
    Table 1. Calculated Dispersion Lengtha, Nonlinear Lengthb, Soliton Orderc, at Different Pulse Duration for Air, Ar, and Kr Gas
    Krishna Murari, Giovanni Cirmi, Hüseyin Cankaya, Gregory J. Stein, Benoit Debord, Frederic Gérôme, Felix Ritzkosky, Fetah Benabid, Oliver Muecke, Franz X. Kärtner. Sub-50 fs pulses at 2050 nm from a picosecond Ho:YLF laser using a two-stage Kagome-fiber-based compressor[J]. Photonics Research, 2022, 10(3): 637
    Download Citation