
Sheng-yuan REN, Ming-yong JING, Hao ZHANG, Xiao-bo WANG, Lin-jie ZHANG. Atom-Based Vector Measurement of Near Field Scattering Field of Radio Frequency Identification Tag[J]. Spectroscopy and Spectral Analysis, 2022, 42(1): 298
- Spectroscopy and Spectral Analysis
- Vol. 42, Issue 1, 298 (2022)
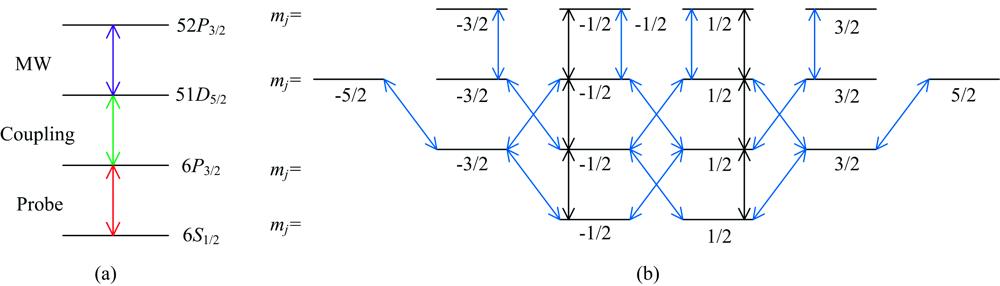
Fig. 1. The four-level system of Cesium Rydberg atoms
(a): Four-level system diagram of cesium atom; (b): The hyperfine energy levels of 6S 1/2, 6P 3/2, 51D 5/2 and 52P 3/2. 52P 3/2 state is shown above the 51D 5/2 state for simplicity
(a): Four-level system diagram of cesium atom; (b): The hyperfine energy levels of 6
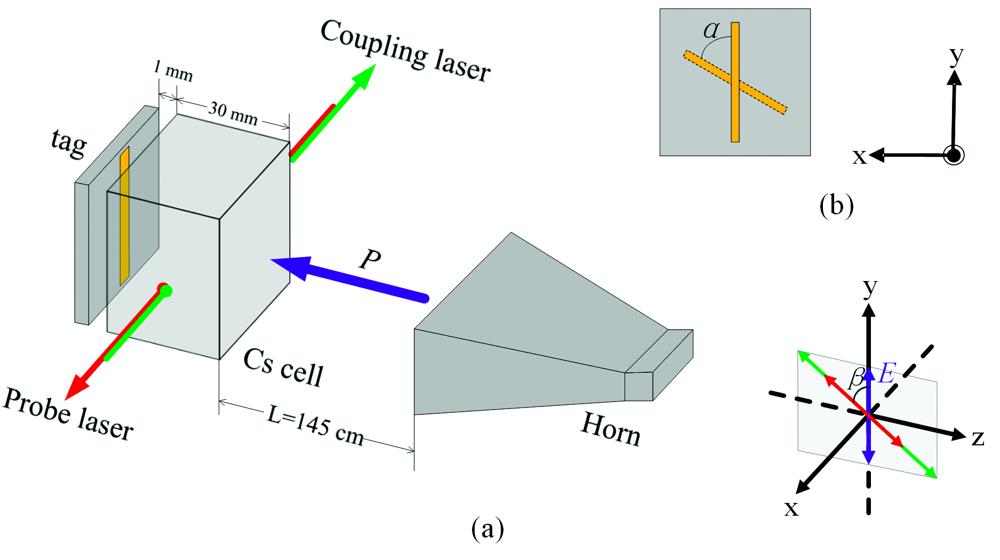
Fig. 2. The scheme of experiment setup
The red and green arrows in fig.(a) respectively indicate the propagation direction of the probe and coupling laser, and their polarization vector correspond to the red and green arrows in the coordinate axis respectively;P represents the propagation direction of microwave electric field, and its polarization direction is shown by the purple arrow on the coordinate axis. β is the angle between two laser beams and the polarization direction of microwave electric field. α in fig.(b) is the angle that the label rotates anticlockwise
The red and green arrows in fig.(a) respectively indicate the propagation direction of the probe and coupling laser, and their polarization vector correspond to the red and green arrows in the coordinate axis respectively;
Fig. 3. EIT-AT spectra
(a): EIT transmission signal without microwave electric field; (b): The EIT-AT splitting spectrum when a microwave electric field is applied andβ =90°; (c): The EIT-AT splitting spectrum when a microwave electric field is applied and β =0°; P 0, P 1, P 2 and P 3 are the peak heights of each peak in Fig.3 , and Δf is the split peak interval of P 1 and P 3
(a): EIT transmission signal without microwave electric field; (b): The EIT-AT splitting spectrum when a microwave electric field is applied and
Fig. 4. EIT-AT spectral characteristics change with β
(a):A 1=P 2/P 0; b: A 2=P 3/P 1. When β =0°, A 1=0, and A 2=1; when -90°<β <0°, A 1 decreases, A 2<1; when 0°<β <90°, A 1 increases, A 2>1
(a):
Fig. 5. The vector measurement result of near field scattering field of the tag
(a): Simulation result of the commercial finite-difference time domain software CST Microwave Studio; (b): Experimental results
(a): Simulation result of the commercial finite-difference time domain software CST Microwave Studio; (b): Experimental results

Set citation alerts for the article
Please enter your email address
© Copyright 2018-2021 | Chinese Laser Press. All Rights Reserved 沪ICP备15018463号-20