- Journal of Semiconductors
- Vol. 40, Issue 2, 022803 (2019)
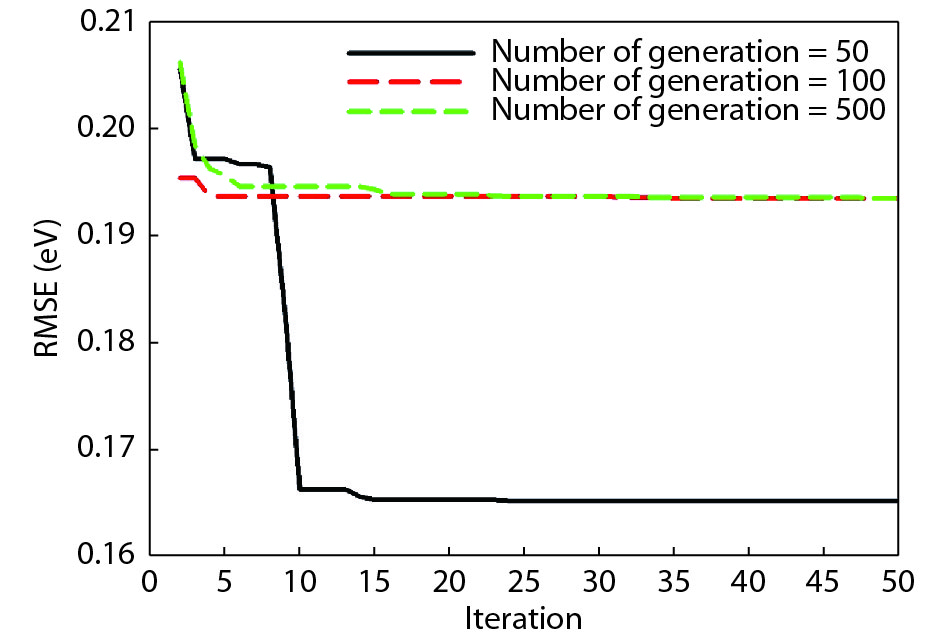
Fig. 1. (Color online) Sensitivity of the developed PSO-SVR model on the number of generation keeping the number of population at 200.
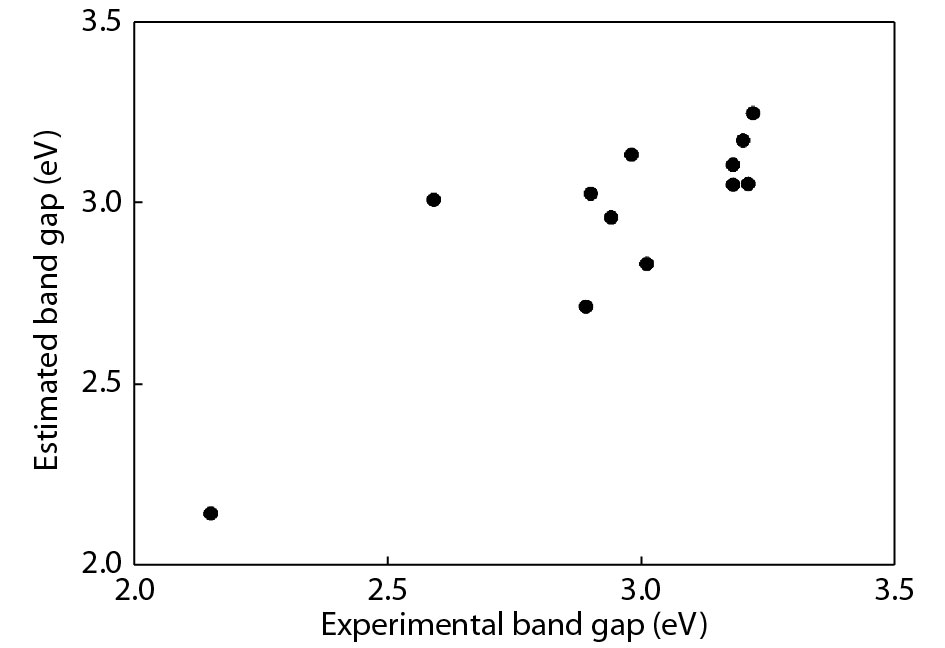
Fig. 2. Correlation cross-plot between the estimated and experimental band gap.
Fig. 3. (Color online) Effect of cobalt-sulfur co-doping on the band gap of TiO2 using the developed PSO-SVR model.
Fig. 4. (Color online) Effect of nickel-iodine co-doping on the band gap of TiO2 using the developed PSO-SVR model.
Fig. 5. (Color online) Effect of tungsten doping on the band gap of TiO2 using the developed PSO-SVR model.
Fig. 6. (Color online) Effect of indium doping on the band gap of TiO2 using the developed PSO-SVR model.
|
Table 1. Statistical analysis of the dataset.
|
Table 2. Optimum model parameters.
|
Table 3. Performance evaluation parameters and their corresponding values.


Set citation alerts for the article
Please enter your email address
© Copyright 2018-2021 | Chinese Laser Press. All Rights Reserved 沪ICP备15018463号-20