- Journal of Semiconductors
- Vol. 40, Issue 2, 022803 (2019)
Abstract
1. Introduction
Titanium dioxide (TiO2) is a wide band gap and n-type semiconductor that offers promising potential in several technological and industrial applications which include gas sensing, photo-catalysis, spintronic, optical interference coating and many others[
The crystal structure of TiO2 is polymorphic in nature and the three most commonly studied phases are rutile, anatase and brookite. Creation of a space charge region through replacement of titanium lattice ions in TiO2 semiconductor with dopant ions has been reported as an effective way of controlling its band structure[
Support vector regression (SVR) is an intelligence learning tool that implements a kernel trick for non-linear problems[
The results of the simulation indicate that the developed PSO-SVR model can estimate the band gap of doped TiO2 semiconductors with root mean square error as low as 0.165 eV. Comparison of the estimated and experimental band gap also shows that the developed PSO-SVR model is promising and can effectively tune the band gap of the semiconductor, relieve the stress involved in the experimental approach and most importantly, widens the potential application of the semiconductors without loss of precision.
2. Description of the proposed PSO-SVR model
The section presents the mathematical background of the developed hybrid model. The operational principles of SVR and PSO algorithms are presented.
2.1. Support vector regression computational intelligence tool
Support vector regression (SVR) is a machine learning tool that was developed based on the structural risk minimization principle (extended from statistical learning theory) which represents a robust statistical machine learning methodology[
where
SVR algorithm solves the optimization problem described by Eq. (2) as subjected to the constraints in Eq. (3)
where
The parameter C contained in Eq. (2) is referred to as the regularization or penalty factor. Its function is to penalize the training samples with deviations larger than the threshold (epsilon). The essence of the slack variables
For non-linear regression problems like the one presented in this work, the training data-points were mapped to high dimension feature space using non-linear mapping function presented in Eq. (4) with kernel option
The final regression problem is presented in Eq. (5) with Langrage multipliers
In SVR algorithm, hyper-parameters
2.2. Particle swarm optimization method of optimizing SVR hyper-parameters
PSO is a population based computational search algorithm which mimics the social behavior of fish schooling or birds flocking in its development, implementation and search for optimum solution. PSO has demonstrated its excellent optimization capability since it was proposed and has been extensively applied to problems in science, engineering as well as technological problems[
where
While developing the PSO algorithm, the potential solution called a particle
3. Methodologies for model development
This section details the description of the employed dataset for modeling and simulation. The computational hybridization of the proposed two algorithms is also presented. The significance of the number of population and generation on the predictive strength of the developed hybrid model is investigated and presented in this section.
3.1. Dataset employed in developing the PSO-SVR model for TiO2 band gap estimation
The hybrid PSO-SVR model was developed using 63 experimental crystal lattice constants and their corresponding band gaps. The lattice constants as well as band gaps were obtained from published work when different impurities and dopants were incorporated into lattice structure of pure TiO2 semiconductor[
The average of the content of the dataset is revealed from the presented statistical results. The range of the dataset as well as the deviation is also presented in the table. This gives enough insight into the content of the dataset and limitation as well the predictive strength of the proposed PSO-SVR model can be inferred from the presented statistical outcome. The correlation coefficient between pair of parameters reveals the degree and the extent of linear relationship that exists between them. The outcomes of the statistical analysis presented in Table 1 show that distortion along the c-axis is negatively correlated with band gap while distortion along the a-axis of pure TiO2 semiconductor is positively correlated with the band gap having a very weak linear relationship. From the results of the correlation, it shows that a linear model would perform poorly in modeling the relationship between lattice parameters and band gap of TiO2 semiconductor and the need for a non-linear model becomes imperative. SVR has numerous advantages that warrant its utilization in this present work. Its predictive strength is not often affected by a small number of datasets and due to this feature it has been extensively applied in condensed matter physics where significant inference needs to be made from few experimental datasets due to the difficulty in obtaining experimental data[
3.2. Description of the computational hybridization of PSO and SVR algorithm
Hybridization of PSO with SVR aims at optimizing SVR hyper-parameters using a PSO algorithm. The hybridization presented in this work was conducted within the MATLAB computing environment. The hyper-parameters that are to be optimized using PSO are the regularization factor (C), epsilon (
where
3.3. Effect of number population on the performance of hybrid PSO-SVR model
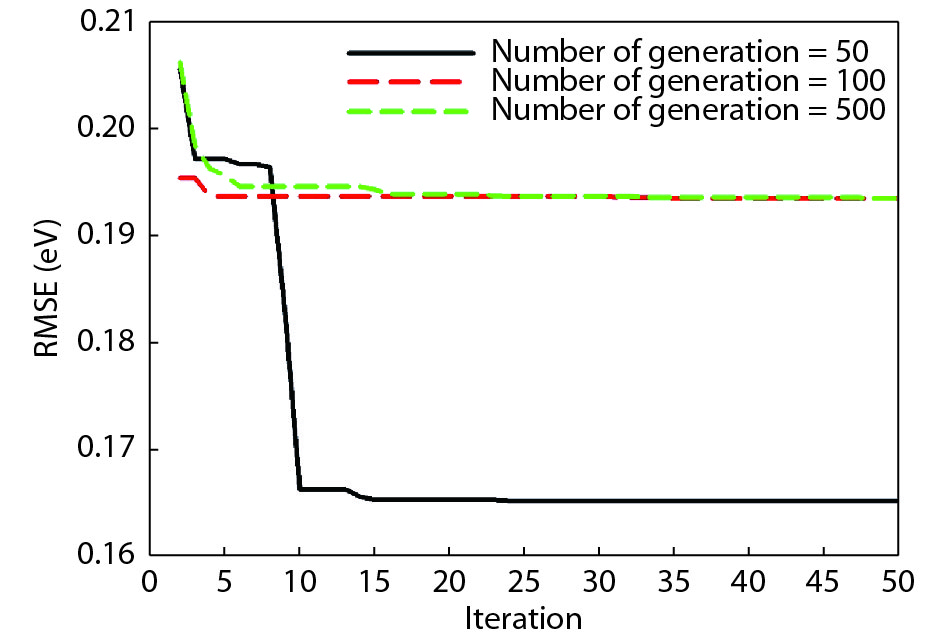
The impact of varying the number of populations to the performance of the developed PSO-SVR model was investigated and the outcome is presented in Fig. 1. The number of generations at which the model shows no further improvement in performance was obtained as 50 and the number of populations that optimizes the model was searched for using this number of generations. The number of populations and generations that optimize the developed PSO-SVR model are presented in Table 2.
![]()
Figure 1.(Color online) Sensitivity of the developed PSO-SVR model on the number of generation keeping the number of population at 200.
Table Infomation Is Not Enable4. Results and discussion
This section presents the results of the hybrid model. The outcomes of the developed hybrid model are also compared with experimentally measured band gaps. Effects of several dopants on the band gap of the semiconductor using the developed model are also discussed and presented.
4.1. Evaluation of the predictive strength of the developed PSO-SVR model
A correlation cross-plot between the band gap estimated using the proposed PSO-SVR model and that of the experimentally reported values is shown in Fig. 2 for testing set of data. The data-points which represent the band gap of doped TiO2 semiconductor show little disparity with reasonable degree of alignment. The value of the coefficient of correlation is presented in Table 3. The developed PSO-SVR model also demonstrates the low value of RMSE as well as the mean absolute error (MAE) as shown in Table 3. The presented results show that the developed model can effectively estimate the band gap of doped TiO2 semiconductor with an average error of 0.125 eV.
![]()
Figure 2.Correlation cross-plot between the estimated and experimental band gap.
Table Infomation Is Not Enable4.2. Influence of cobalt-sulfur co-doping on the band gap of TiO2 semiconductor using the developed PSO-SVR model
The predictive strength of the developed PSO-SVR model was further assessed using doped TiO2. The effect of incorporating cobalt and sulfur into the crystal lattice structure of TiO2 semiconductor was investigated and the estimated band gaps were compared with the reported values[
![]()
Figure 3.(Color online) Effect of cobalt-sulfur co-doping on the band gap of TiO2 using the developed PSO-SVR model.
4.3. Influence of nickel-iodine co-doping on the band gap of TiO2 semiconductor using the developed PSO-SVR model
The ability of nickel-iodine co-doping in tuning the band gap of TiO2 semiconductor was also examined using the developed PSO-SVR model. The results of the model are compared with the experimental results in Fig. 4. The PSO-SVR estimated band gaps agree perfectly with the experimental values[
![]()
Figure 4.(Color online) Effect of nickel-iodine co-doping on the band gap of TiO2 using the developed PSO-SVR model.
4.4. Effect of tungsten doping on the band gap of TiO2 semiconductor using the developed PSO-SVR model
The effect of metal doping (tungsten) on the band gap of TiO2 semiconductor was also investigated using the developed PSO-SVR model. The result of the simulation shows that tungsten metal slightly alters the band gap of the semiconductor. These results are compared with the experimentally reported band gaps[
![]()
Figure 5.(Color online) Effect of tungsten doping on the band gap of TiO2 using the developed PSO-SVR model.
4.5. Effect of indium doping on the band gap of TiO2 semiconductor using the developed PSO-SVR model
Finally, the developed model was implemented in investigating the effect of indium particles on the band gap of TiO2 semiconductor by feeding the experimentally reported lattice parameters[
![]()
Figure 6.(Color online) Effect of indium doping on the band gap of TiO2 using the developed PSO-SVR model.
5. Conclusion
In this work, PSO is hybridized with SVR algorithm leading to the development of PSO-SVR model for band gaps estimation of doped TiO2 semiconductor. The developed PSO-SVR model was validated using a testing set of data and minimum RMSE and MAE were obtained. The ability of the model to generalize and predict unseen datasets was further investigated. The developed PSO-SVR model was used to estimate the influence of several dopants on the band gap of TiO2 semiconductor and excellent agreement with the experimentally reported band gaps was obtained. The influence of cobalt-sulfur co-doping, nickel-iodine co-doping, tungsten doping and indium doping on the band gap of TiO2 semiconductor as estimated using the developed model shows excellent agreement with the experimental values. Based on the results presented in this work, the developed PSO-SVR model shows promising potential in photo-catalysis and other important applications where band gap engineering of TiO2 semiconductor is essential and the model can be deployed for industrial and technological use so as to ease the stress in experimental determination of band gaps of doped TiO2 semiconductor.
Acknowledgements
The support of King Fahd University of Petroleum and Minerals is acknowledged. The author also would like to thank Kabiru O. Akande (University of Edinburgh) for his valuable time spent to review the first draft of this manuscript.
Appendix
List of abbreviations
SVR: Support vector regression
PSO: Particle swarm optimization
TiO2: Titanium dioxide semiconductor
C: Regularization factor
References
[1] M Kumar, A K Gupta, D Kumar. Mg-doped TiO2 thin films deposited by low cost technique for CO gas monitoring. Ceram Int, 42, 405(2015).
[2] U Diebold. The surface science of titanium dioxide. Surf Sci Rep, 48, 53(2003).
[3] B Yacoubi, L Samet, J Bennaceur et al. Properties of transition metal doped-titania electrodes: Impact on efficiency of amorphous and nanocrystalline dye-sensitized solar cells. Mater Sci Semicond Process, 30, 361(2015).
[4]
[5] M Hamadanian, S Karimzadeh, V Jabbari et al. Synthesis of cysteine, cobalt and copper-doped TiO2 nanophotocatalysts with excellent visible-light-induced photocatalytic activity. Mater Sci Semicond Process, 41, 168(2016).
[6] S A Ahmed. Annealing effects on structure and magnetic properties of Mn-doped TiO2. J Magn Magn Mater, 402, 178(2016).
[7] L Kernazhitsky, V Shymanovska, T Gavrilko et al. Photoluminescence of Cr-doped TiO2 induced by intense UV laser excitation. J Lumin, 166, 253(2015).
[8] T Potlog, P Dumitriu, M Dobromir et al. Nb-doped TiO2 thin films for photovoltaic applications. Mater Des, 85, 558(2015).
[9] A Arunachalam, S Dhanapandian, C Manoharan et al. Physical properties of Zn doped TiO2 thin films with spray pyrolysis technique and its effects in antibacterial activity. Spectrochim. Acta - Part A Mol Biomol Spectrosc, 138, 105(2015).
[10] M Mollavali, C Falamaki, S Rohani. Preparation of multiple-doped TiO2 nanotube arrays with nitrogen, carbon and nickel with enhanced visible light photoelectrochemical activity via single-step anodization. Int J Hydrogen Energy, 40, 12239(2015).
[11] A Siddiqa, D Masih, D Anjum et al. Cobalt and sulfur co-doped nano-size TiO2 for photodegradation of various dyes and phenol. J Environ Sci (China), 37, 100(2015).
[12] C McManamon, J O’Connell, P Delaney et al. A facile route to synthesis of S-doped TiO2 nanoparticles for photocatalytic activity. J Mol Catal.A Chem, 406, 51(2015).
[13]
[14] K O Akande, T O Owolabi, S O Olatunji et al. A novel homogenous hybridization scheme for performance improvement of support vector machines regression in reservoir characterization. Appl Comput Intell Soft Comput, 2016, 1(2016).
[15] T O Owolabi, K O Akande, S O Olatunji. Computational intelligence method of estimating solid- liquid interfacial energy of materials at their melting temperatures. J Intell Fuzzy Syst, 31, 519(2016).
[16] T O Owolabi, K O Akande, S O Olatunji. Computational intelligence approach for estimating superconducting transition temperature of disordered MgB2 superconductors using room temperature resistivity. Appl Comput Intell Soft Comput, 2016, 1709827(2016).
[17] T O Owolabi, K O Akande, S O Olatunji. Estimation of average surface energies of transition metal nitrides using computational intelligence technique. Soft Comput, 21, 6175(2017).
[18] T O Owolabi, M Faiz, S O Olatunji et al. Computational intelligence method of determining the energy band gap of doped ZnO semiconductor. Mater Des, 101, 277(2016).
[19] M A Suleiman, T O Owolabi, H B Adeyemo et al. Modeling of autoignition temperature of organic energetic compounds using hybrid intelligent method. Process Saf Environ Prot, 120, 79(2018).
[20] M Ghorbani, G Zargar, H Jazayeri-Rad. Prediction of asphaltene precipitation using support vector regression tuned with genetic algorithms. Petroleum, 2, 301(2016).
[21] L Zhou, K K Lai, Yu L. Credit scoring using support vector machines with direct search for parameters selection. Soft Comput, 13, 149(2009).
[22] P J G Nieto, J R A Fernández, V M G Suárez et al. A hybrid PSO optimized SVM-based method for predicting of the cyanotoxin content from experimental cyanobacteria concentrations in the Trasona reservoir: A case study in Northern Spain. Appl Math Comput, 260, 170(2015).
[23] P J Garcia Nieto, E Garcia-Gonzalo, F Sanchez Lasheras et al. Hybrid PSO-SVM-based method for forecasting of the remaining useful life for aircraft engines and evaluation of its reliability. Reliab Eng Syst Saf, 138, 219(2015).
[24] J Kennedy, R Eberhart. Particle swarm optimization. IEEE International Conference on Particle swarm optimization, 4, 1942(1995).
[25]
[26] X Zhang, P Wang, D Liang et al. A soft self-repairing for FBG sensor network in SHM system based on PSO-SVR model reconstruction. Opt Commun, 343, 38(2015).
[27] D Basak, S Pal, D C Patranabis. Support vector regression. Neural Inf Process Lett Rev, 11(2007).
[28] R D A Timoteo, L N Silva, D C Cunha et al. An approach using support vector regression for mobile location in cellular networks. Comput Networks, 95, 51(2016).
[29] A Nazari, J G Sanjayan. Modelling of compressive strength of geopolymer paste, mortar and concrete by optimized support vector machine. Ceram Int, 41, 12164(2015).
[30] M A Abido. Optimal power flow using particle swarm optimization. Int J Electr Power Energy Syst, 24, 563(2002).
[31] W Khan, S Ahmad, M M Hassan et al. Structural phase analysis , band gap tuning and fluorescence properties of Co doped TiO2 nanoparticles. Opt Mater (Amst), 38, 278(2016).
[32] E O Oseghe, P G Ndungu, S B Jonnalagadda. Photocatalytic degradation of 4-chloro-2-methylphenoxyacetic acid using W-doped TiO2. J Photochem Photobiol A Chem, 312, 96(2015).
[33] M Tahir, N S Amin. Photocatalytic CO2 reduction with H2 as reductant over copper and indium co-doped TiO2 nanocatalysts in a monolith photoreactor. Appl Catal A Gen, 493, 90(2015).
[34] I Rangel-Vazquez et al. Synthesis and characterization of Sn doped TiO2 photocatalysts: Effect of Sn concentration on the textural properties and on the photocatalytic degradation of 2,4-dichlorophenoxyacetic acid. J Alloys Compd, 643, S144(2015).
[35] Y H Lin, T K Tseng, H Chu. Photo-catalytic degradation of dimethyl disulfide on S and metal-ions co-doped TiO2 under visible-light irradiation. Appl Catal A Gen, 469, 221(2014).
[36] L Yu, X Yang, J He, Y He et al. One-step hydrothermal method to prepare nitrogen and lanthanum co-doped TiO2 nanocrystals with exposed {001} facets and study on their photocatalytic activities in visible light. J Alloys Compd, 637, 308(2015).
[37] X F Lei, X X Xue, H Yang. Preparation and characterization of Ag-doped TiO2 nanomaterials and their photocatalytic reduction of Cr(VI) under visible light. Appl Surf Sci, 321, 396(2014).
[38] T O Owolabi, K O Akande, S O Olatunji. Development and validation of surface energies estimator (SEE) using computational intelligence technique. Comput Mater Sci, 101, 143(2015).
[39] A Majid, A Khan, G Javed et al. Lattice constant prediction of cubic and monoclinic perovskites using neural networks and support vector regression. Comput Mater Sci, 50, 363(2010).
[40] C Z Cai, G L Wang, Y F Wen et al. Superconducting transition temperature T c estimation for superconductors of the doped MgB2 system using topological index via support vector regression. J Supercond Nov Magn, 23, 745(2010).
[41] C Z Cai, T T Xiao, J L Tang et al. Analysis of process parameters in the laser deposition of YBa2Cu3O7 superconducting films by using SVR. Phys C Supercond, 493, 100(2013).
[42] T O Owolabi, K O Akande, S O Olatunji. Estimation of superconducting transition temperature T C for superconductors of the doped MgB2 system from the crystal lattice parameters using support vector regression. J Supercond Nov Magn(2014).
[43] A E Giannakas, M Antonopoulou, Y Deligiannakis et al. Preparation, characterization of N-I co-doped TiO2 and catalytic performance toward simultaneous Cr(VI) reduction and benzoic acid oxidation. Appl Catal B Environ, 140/141, 636(2013).
[44] M Tahir, N S Amin. Indium-doped TiO2 nanoparticles for photocatalytic CO2 reduction with H2O vapors to CH4. Appl Catal B Environ, 162, 98(2015).


Set citation alerts for the article
Please enter your email address
© Copyright 2018-2021 | Chinese Laser Press. All Rights Reserved 沪ICP备15018463号-20