• Infrared and Laser Engineering
  • Vol. 51, Issue 5, 20220294 (2022)
You Gao, Tuo Liu, Siyu Wang, and Hairun Guo
Author Affiliations
  • Joint International Research Laboratory of Specialty Fiber Optics and Advanced Communication, Key Laboratory of Specialty Fiber Optics and Optical Access Networks, Shanghai University, Shanghai 200444, China
  • show less
    DOI: 10.3788/IRLA20220294 Cite this Article
    You Gao, Tuo Liu, Siyu Wang, Hairun Guo. Fabrication and optical frequency comb generation in high-quality factor silicon oxide microcavity (Invited)[J]. Infrared and Laser Engineering, 2022, 51(5): 20220294 Copy Citation Text show less
    Fabrication of microcavity. (a) Schematic diagram of SiO2 micro-cavity preparation; (b) Picture of SiO2 crystalline resonator
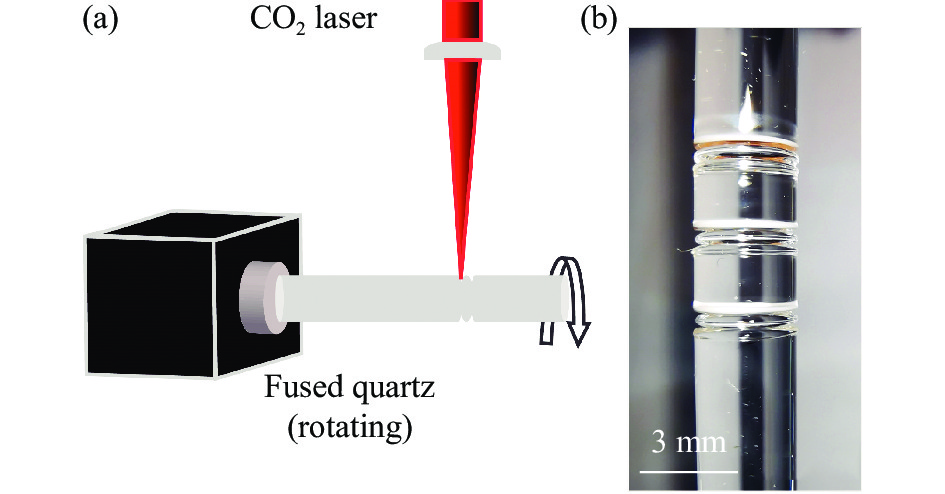
    Fig. 1. Fabrication of microcavity. (a) Schematic diagram of SiO2 micro-cavity preparation; (b) Picture of SiO2 crystalline resonator
    Morphology of microcavity. (a) 3D surface profile of the microcavity; (b) Surface roughness diagram of microcavity; (c)-(d) Characterization of microcavity roundness
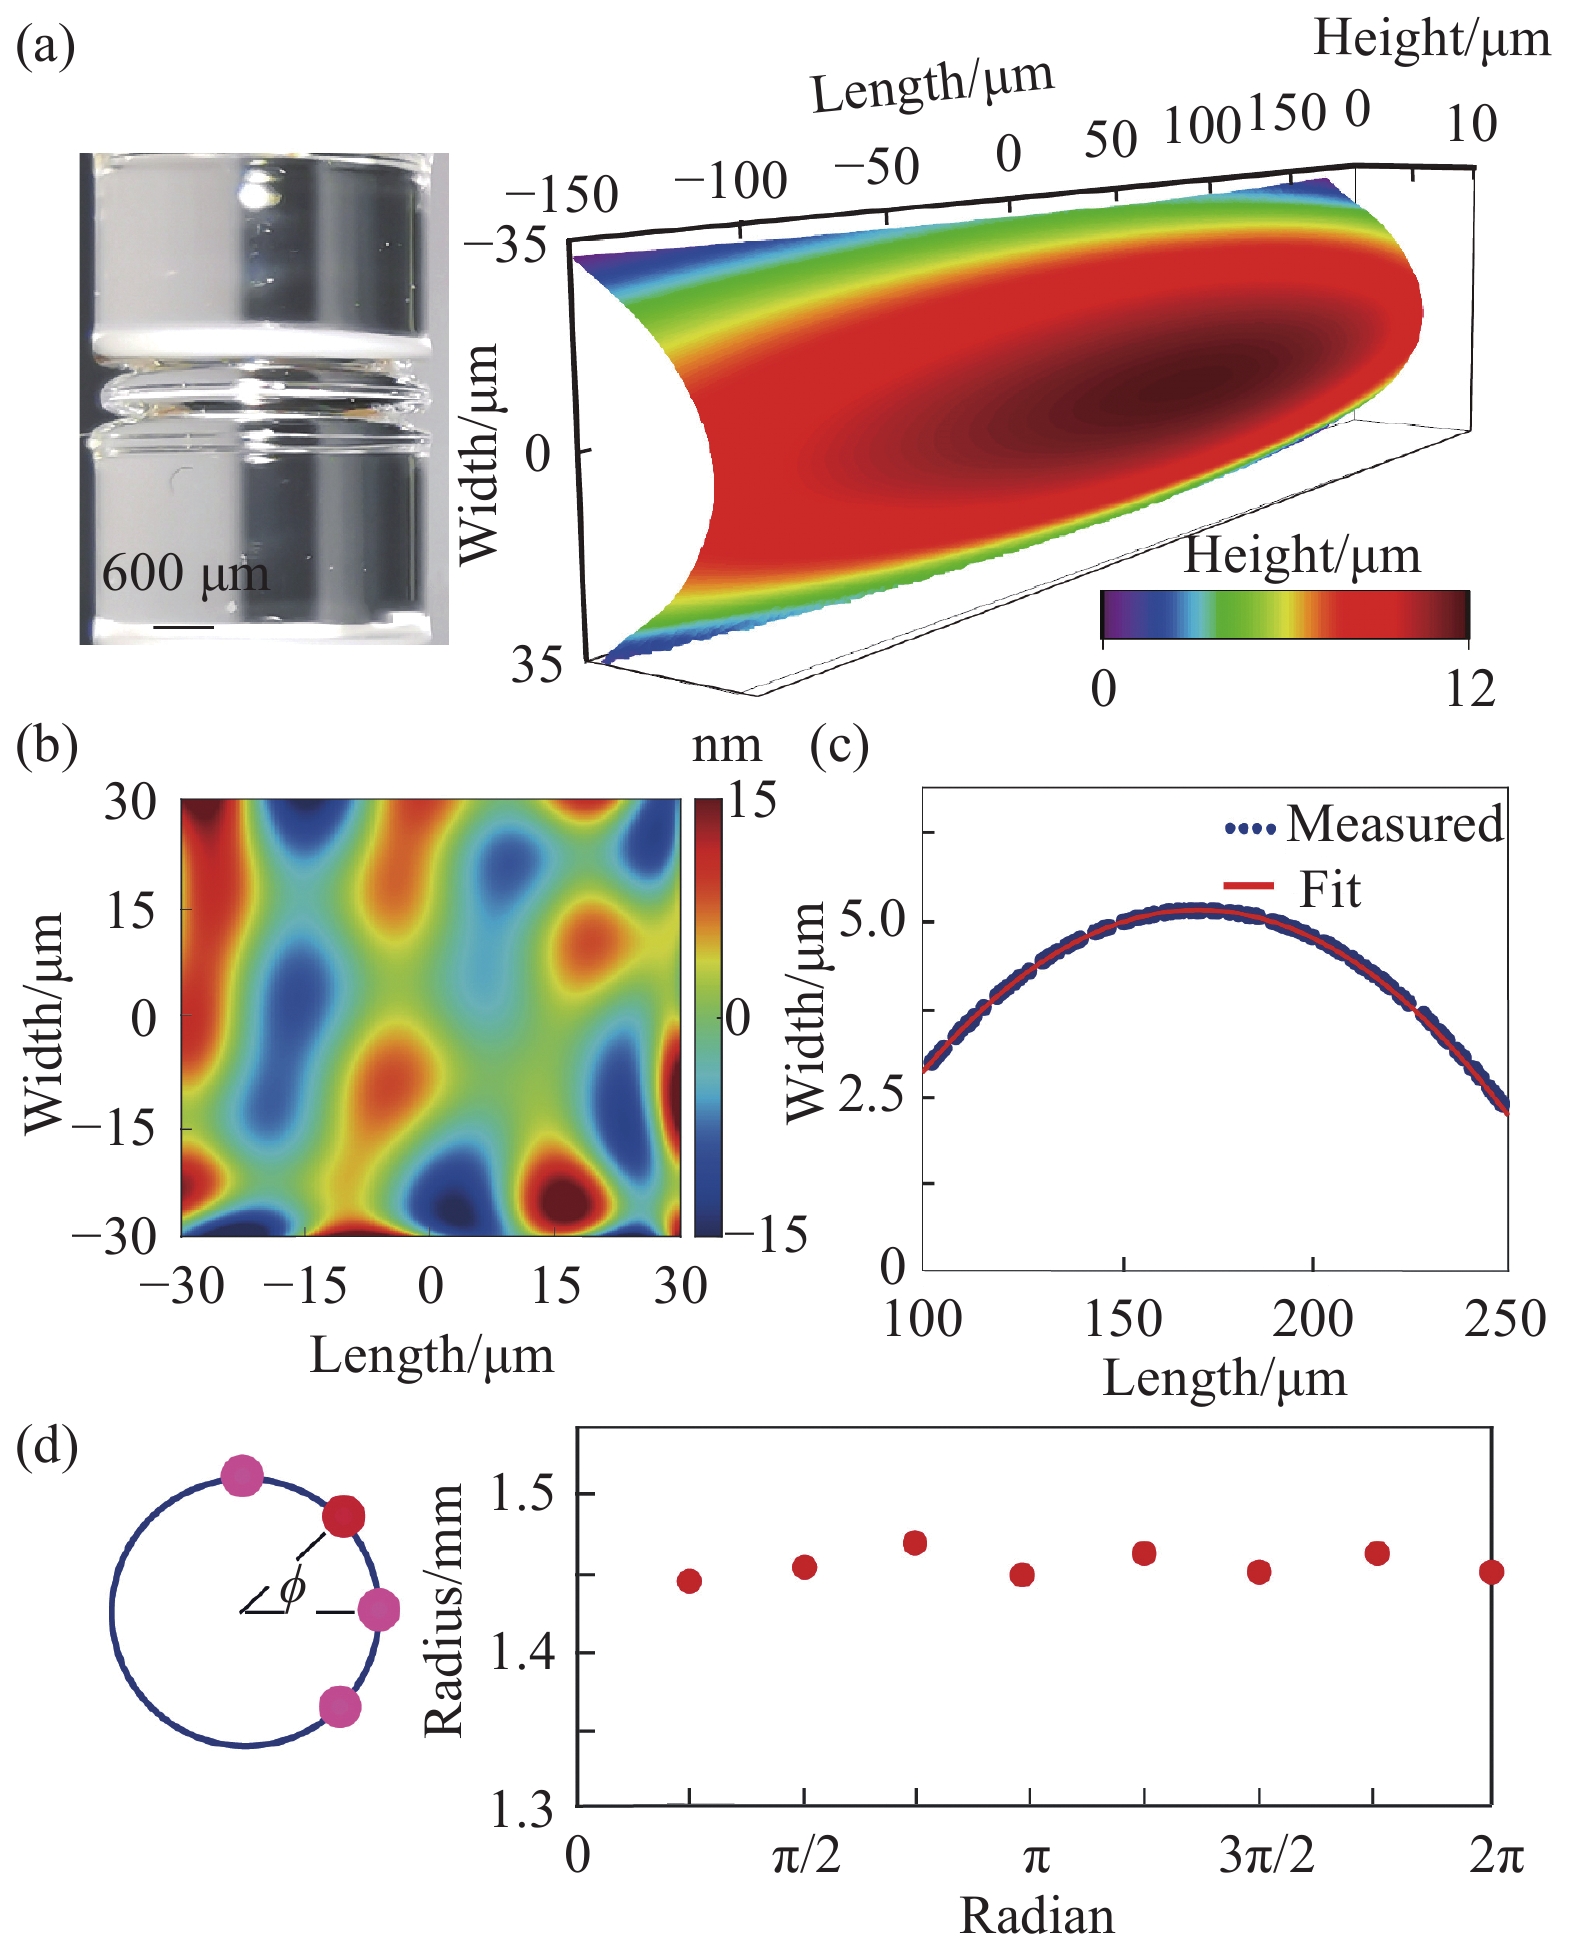
    Fig. 2. Morphology of microcavity. (a) 3D surface profile of the microcavity; (b) Surface roughness diagram of microcavity; (c)-(d) Characterization of microcavity roundness
    Measurement of resonant peak of SiO2 microcavity. (a) Schematic diagram of microcavity coupling test; (b) Power transmission spectrum of microcavity; (c) Lorentz fitting spectral line; (d) Ringdown fitting
    Fig. 3. Measurement of resonant peak of SiO2 microcavity. (a) Schematic diagram of microcavity coupling test; (b) Power transmission spectrum of microcavity; (c) Lorentz fitting spectral line; (d) Ringdown fitting
    Coupling characteristics of microcavity
    Fig. 4. Coupling characteristics of microcavity
    Decay curve of microcavity Q value with time
    Fig. 5. Decay curve of microcavity Q value with time
    Optical frequency comb generation. (a) Transmission lines of microcavity at high pump power;(b) Partially amplified transmission line of Fig.(a); (c)-(e) Evolution process of optical frequency comb corresponds to three different positions of microcavity transmission line in Fig.(a)
    Fig. 6. Optical frequency comb generation. (a) Transmission lines of microcavity at high pump power;(b) Partially amplified transmission line of Fig.(a); (c)-(e) Evolution process of optical frequency comb corresponds to three different positions of microcavity transmission line in Fig.(a)
    Simulated optical frequency comb evolution based on LLE. (a) Figures I, II,III and IV show the evolution process of optical frequency comb; (b) Corresponding to the time-domain spectra in different comb states in Fig.(a)
    Fig. 7. Simulated optical frequency comb evolution based on LLE. (a) Figures I, II,III and IV show the evolution process of optical frequency comb; (b) Corresponding to the time-domain spectra in different comb states in Fig.(a)
    Depth0.60.50.40.30.20.10
    Initial Q value -3.23×10⁸-2.14×1081.43×108--
    Before annealing1.78×1081.66×1088.57×1076.9×1076.1×1075.7×1075.96×107
    After annealing3.11×1082.12×1081.59×1081.3×1087.9×1077.1×1077.57×107
    Table 1. Change of Q value of microcavity before and after annealing
    You Gao, Tuo Liu, Siyu Wang, Hairun Guo. Fabrication and optical frequency comb generation in high-quality factor silicon oxide microcavity (Invited)[J]. Infrared and Laser Engineering, 2022, 51(5): 20220294
    Download Citation