
Xiaoyu Zhang, Sheng Cui, Deming Liu, Yang Jiang. Performance Analysis of Multi-Aperture Coherent Optical Receiver for Satellite-to-Ground Downlink[J]. Laser & Optoelectronics Progress, 2019, 56(21): 210101
- Laser & Optoelectronics Progress
- Vol. 56, Issue 21, 210101 (2019)
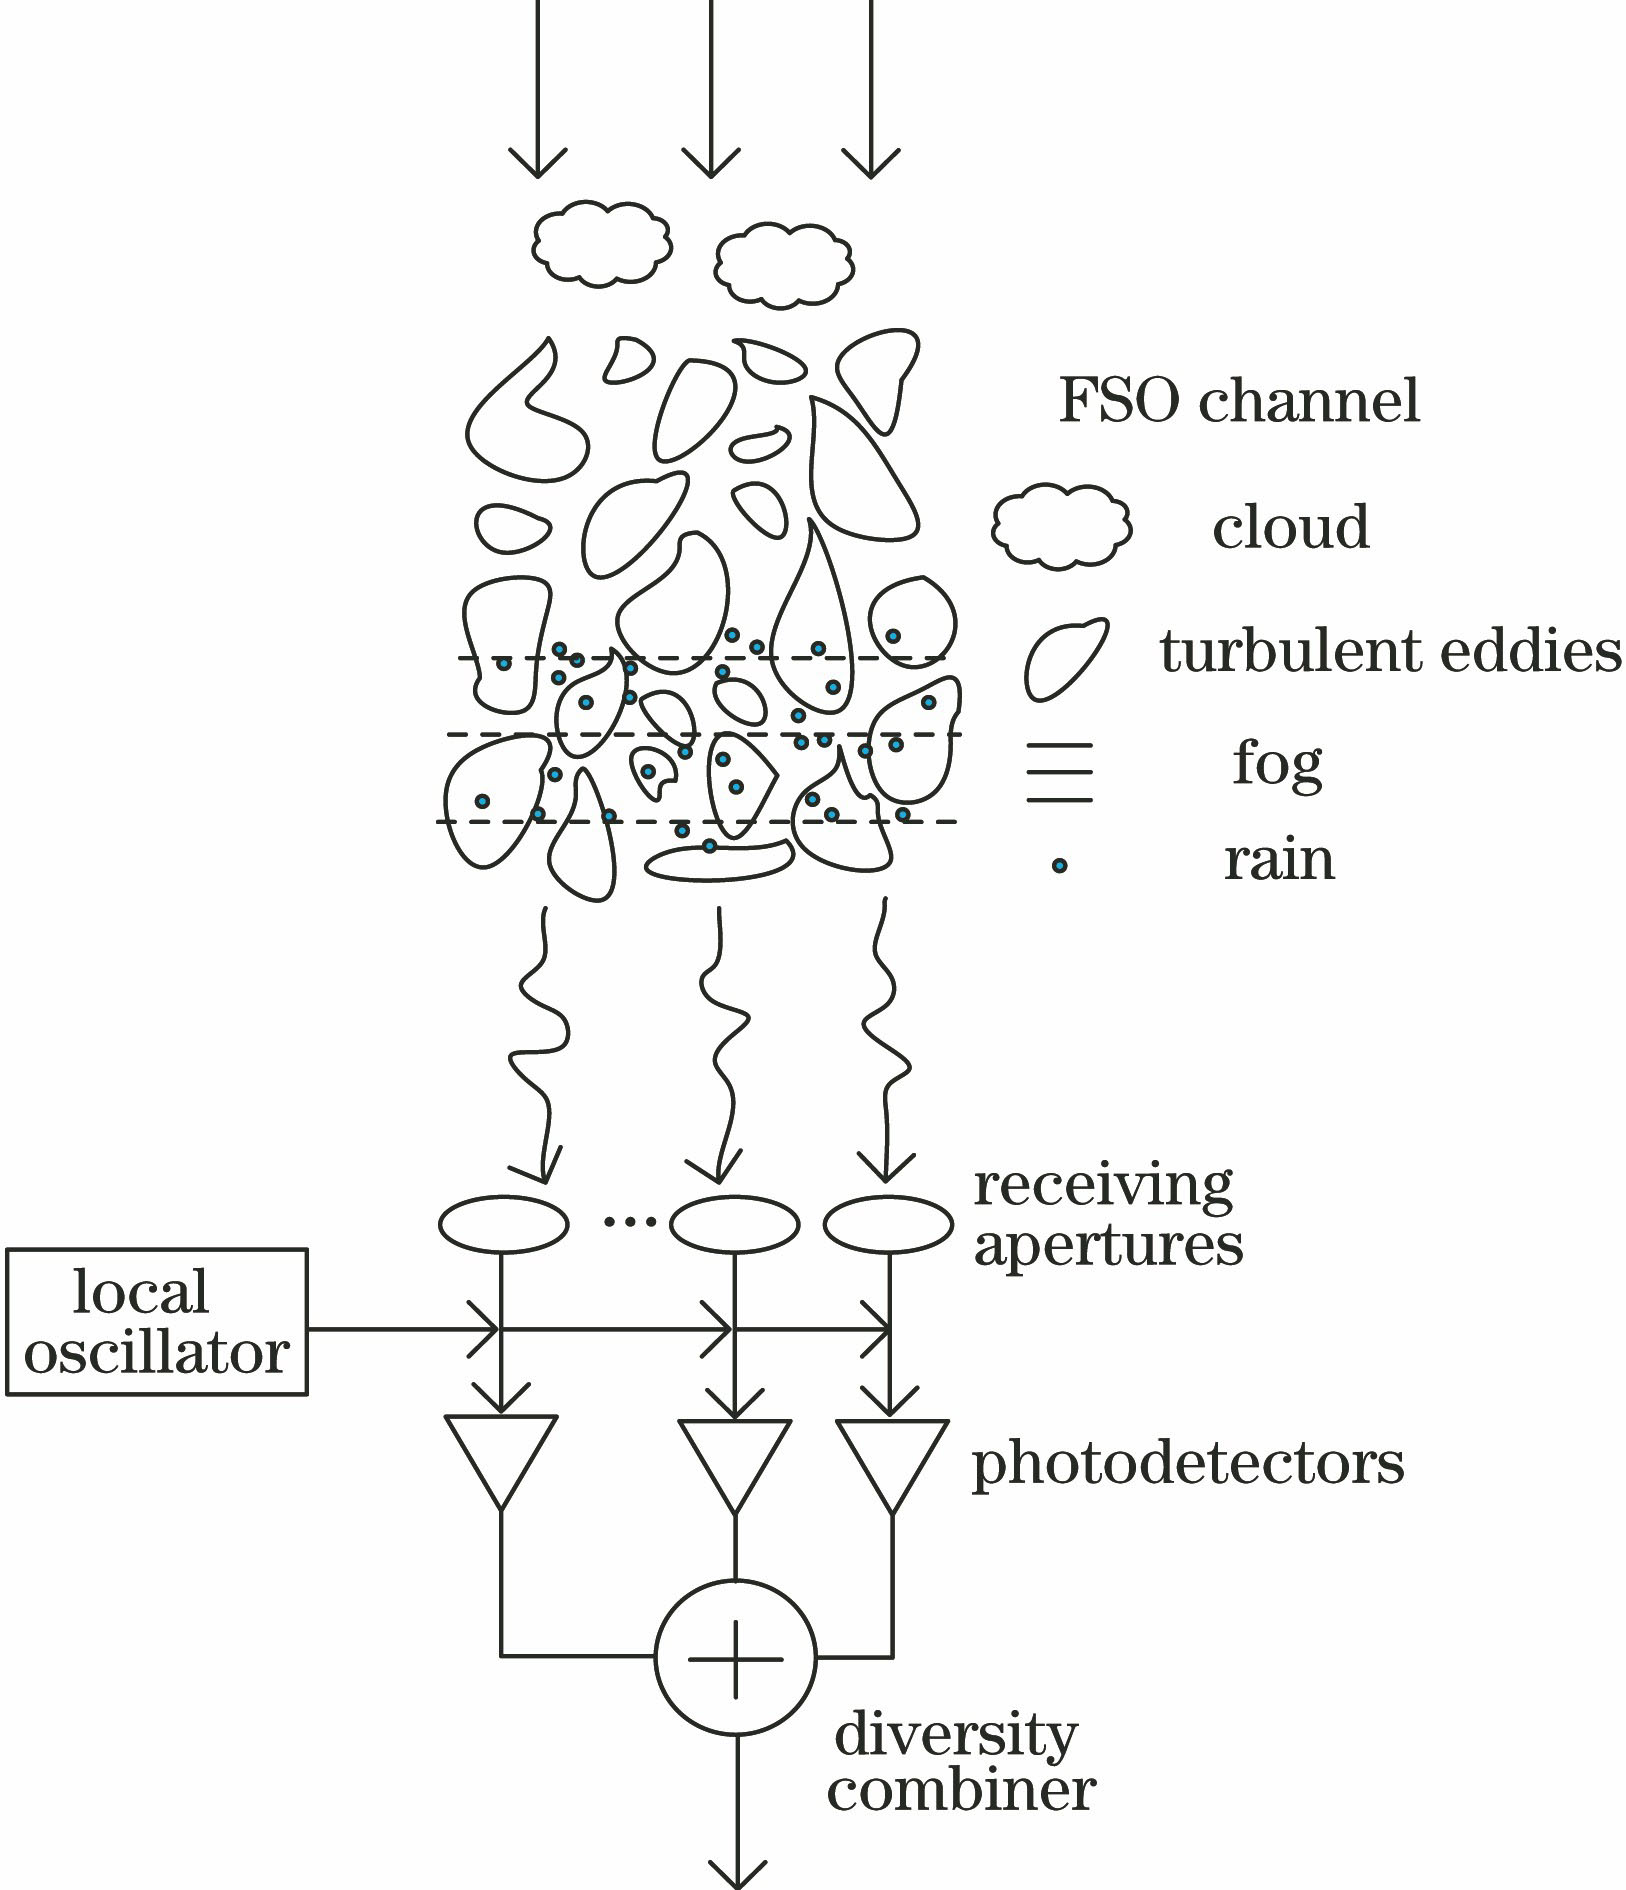
Fig. 1. Structure diagram of multi-aperture coherent optical receiver for downlink free space optical (FSO)communication
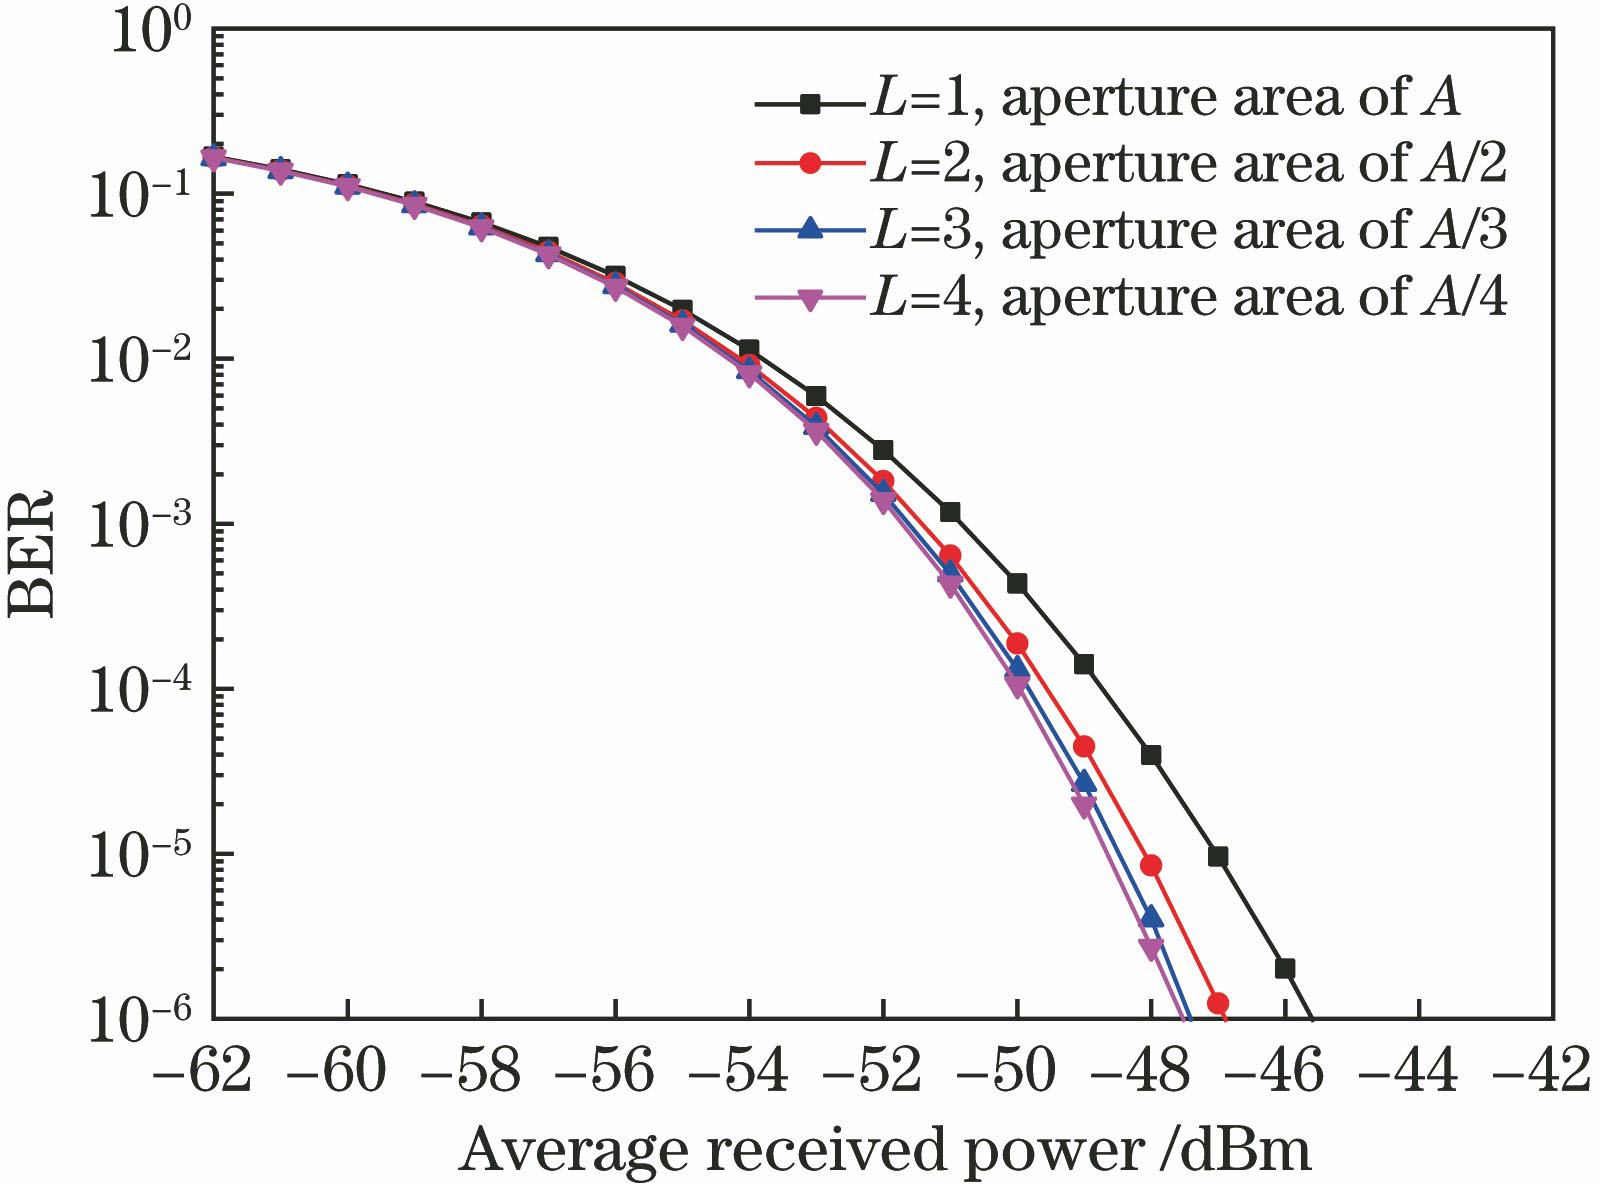
Fig. 2. Relationship between average received power and BER for EGC coherent point receiver model under clean air condition in weak turbulence
Fig. 3. Relationship between average received power and BER for EGC coherent point receiver modelunder clean air condition in strong turbulence
Fig. 4. Relationship between receiving antenna diameter D and Rytov variance σ R 2
Fig. 5. Relationship between average received power and BER for L -channel EGC coherent optical receiver model with diameter of D under different fog conditions in weak turbulence. (a) Clean air; (b) light fog; (c) moderate fog; (d) thick fog; (e) dense fog
Fig. 6. Relationship between average received power and BER for L -channel with EGC coherent optical receiver model with diameter of D under different fog conditions in strong turbulence. (a) Clean air; (b) light fog; (c) moderate fog; (d) thick fog; (e) dense fog
|
Table 1. Weather condition parameters for 1550-nm wavelength signal
|
Table 2. Simulation parameters of satellite-to-ground downlink
| |||||||||||||||||||
Table 3. Sensitivity for coherent point receiver model under clean air condition in weak turbulence and strong turbulence (BER is 10-6)
| ||||||||||||||||||||||||||||||||||||||||||||||||||||||||||||||
Table 4. Sensitivity for L-channel coherent optical receiver model with diameter of D under different fog conditions in weak turbulence and strong turbulence (BER is 10-6)

Set citation alerts for the article
Please enter your email address
© Copyright 2018-2021 | Chinese Laser Press. All Rights Reserved 沪ICP备15018463号-20