
Xinyu Chen, Wei Ding, Ying-Ying Wang, Shou-Fei Gao, Feixiang Xu, Huichao Xu, Yi-Feng Hong, Yi-Zhi Sun, Pu Wang, Yan-Qing Lu, Lijian Zhang. High-fidelity, low-latency polarization quantum state transmissions over a hollow-core conjoined-tube fiber at around 800 nm[J]. Photonics Research, 2021, 9(4): 460
- Photonics Research
- Vol. 9, Issue 4, 460 (2021)
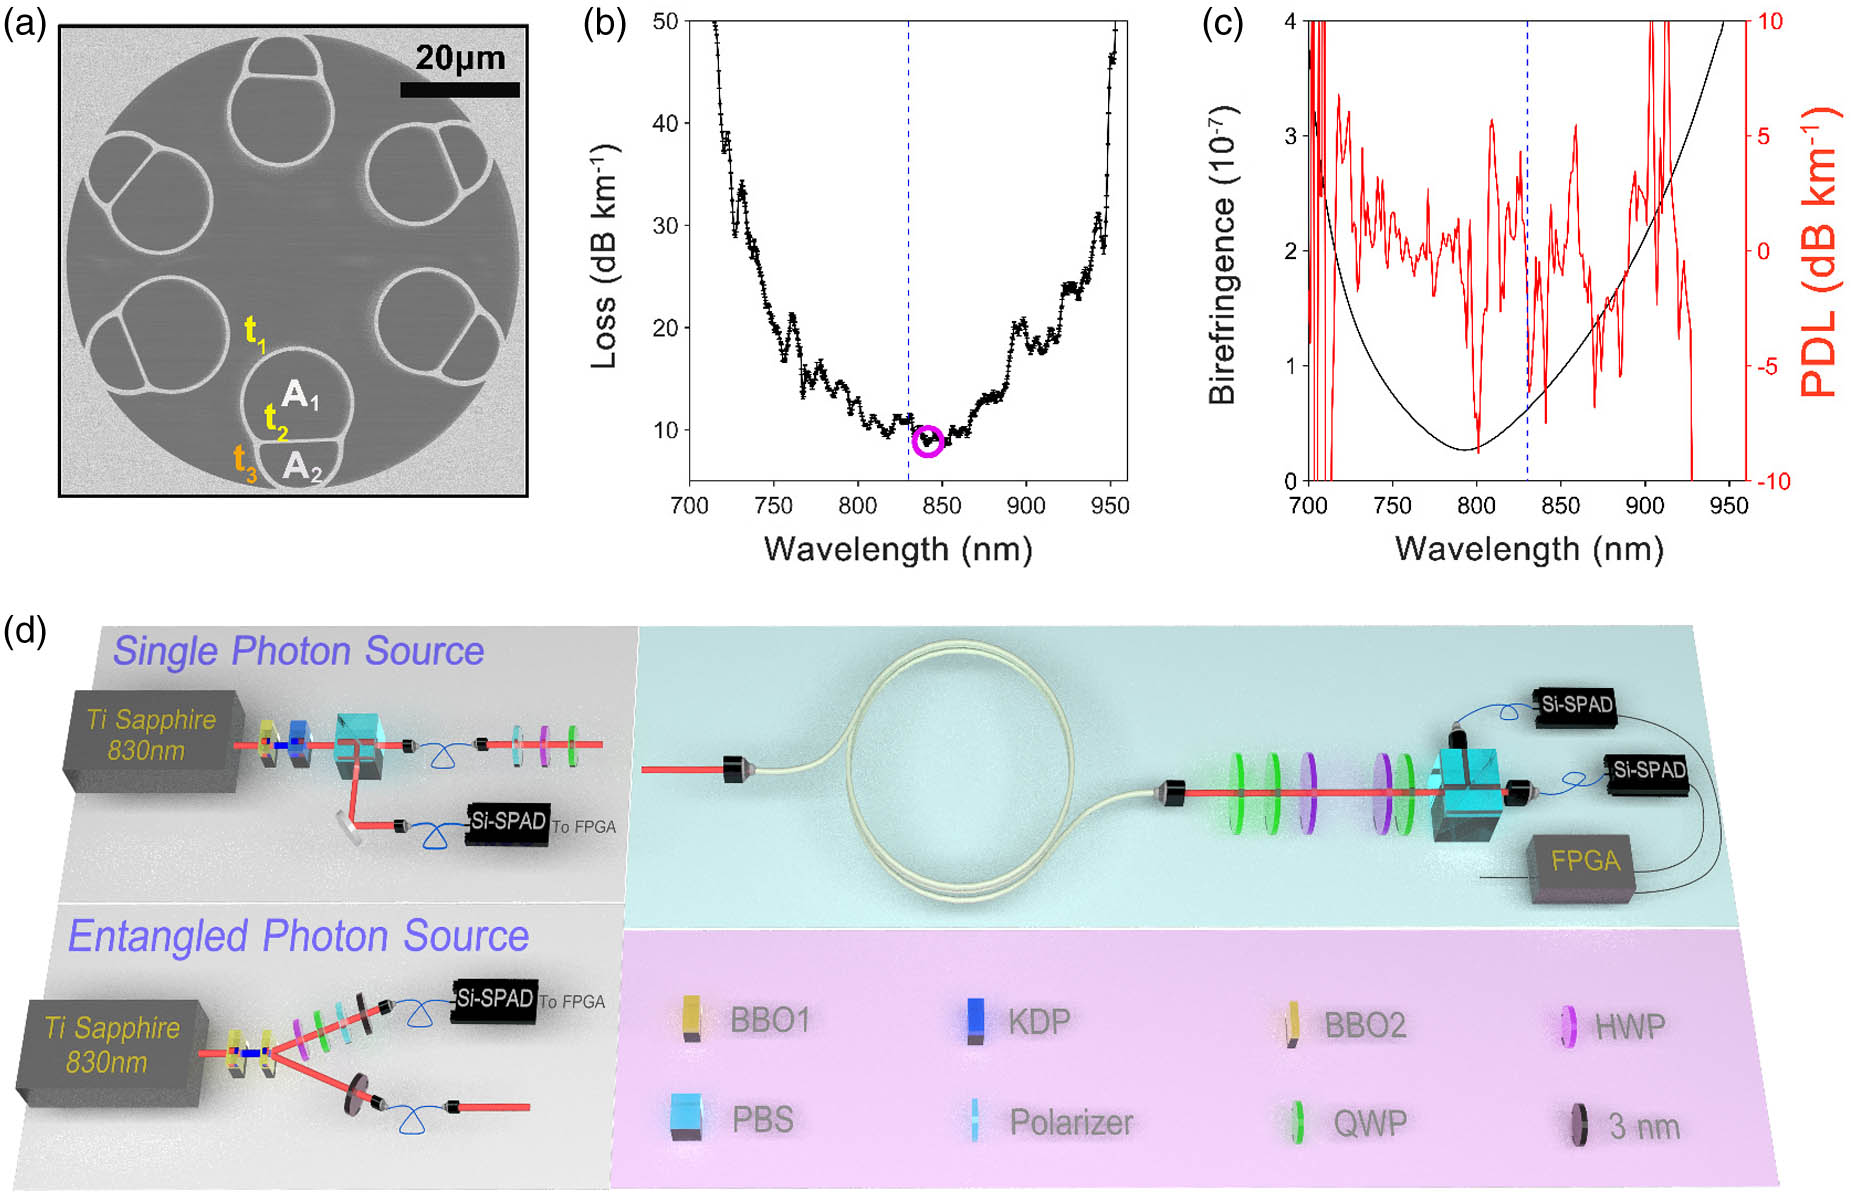
Fig. 1. Characterization of the conjoined-tube fiber (CTF) and experimental setup for polarization quantum state transmission. (a) SEM image of the CTF. (b) Cut-back measured loss spectrum. The minimum loss and quantum transmission wavelength are marked by the purple circle and blue dashed line, respectively. (c) Simulated phase birefringence and PDL based on cross-section micrographs. (d) Experimental setup consisting of a heralded single-photon source (upper left), polarization entangled photon-pair source (lower left), and fiber-testing bench. BBO1/BBO2, β
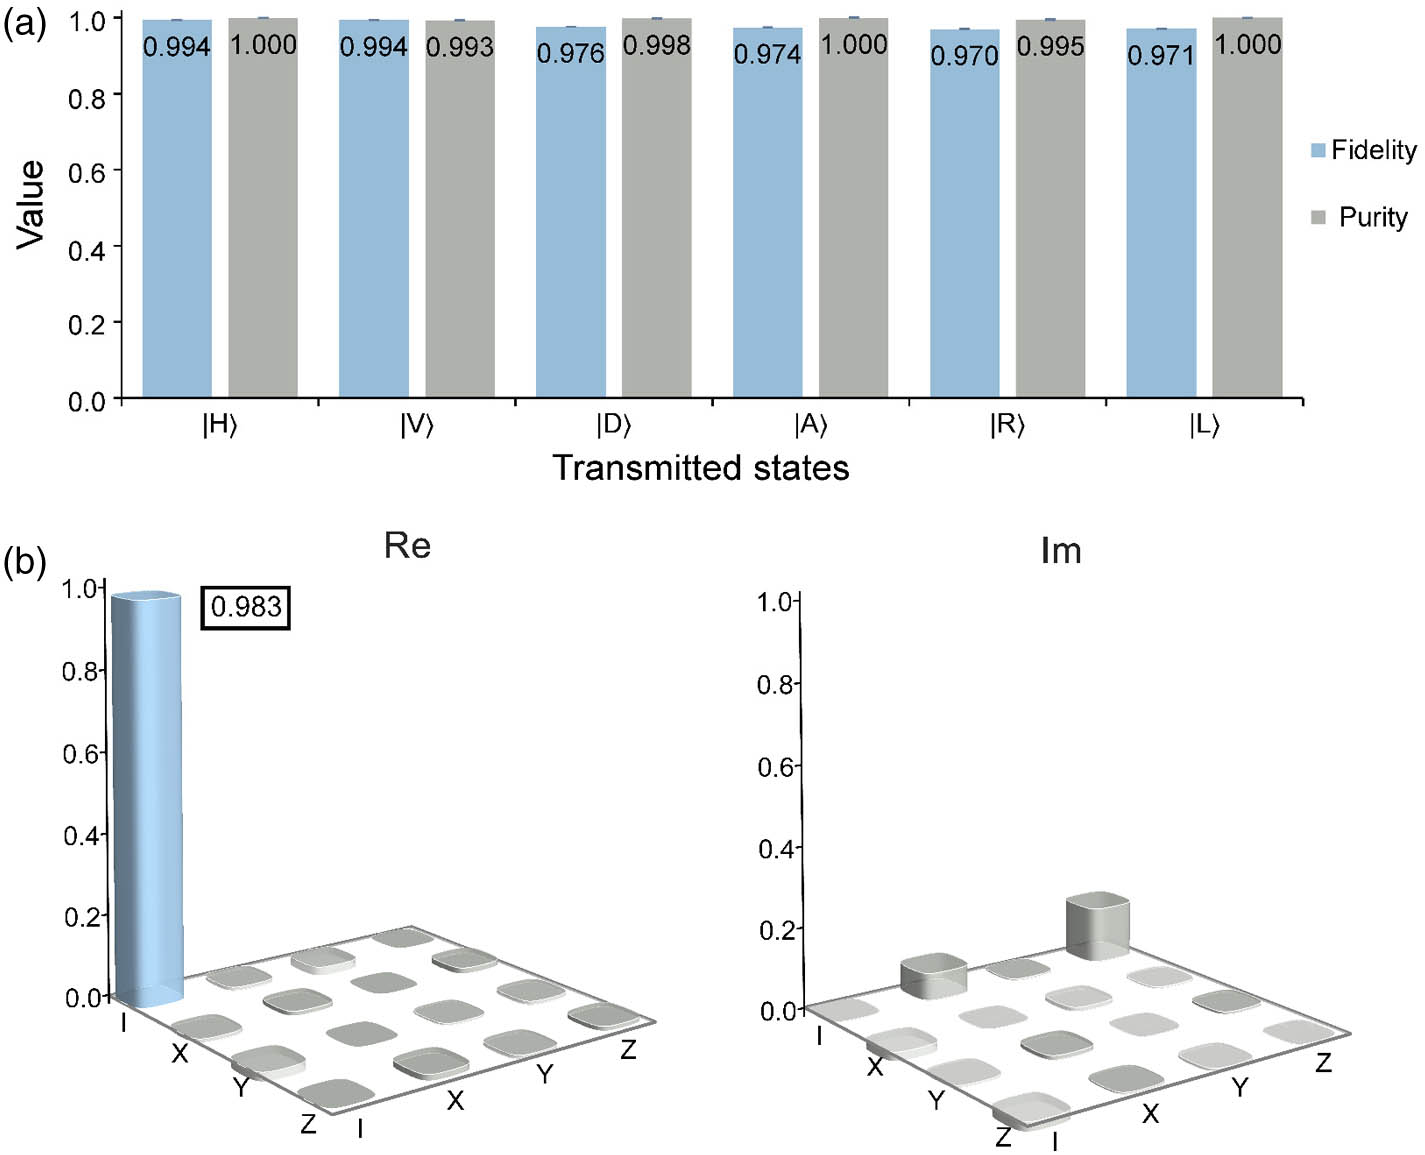
Fig. 2. Experimental results of single-photon polarization state transmission. (a) Fidelities and purities of the six transmitted polarization states. The average fidelity and purity are ∼ 0.980 ∼ 0.998
Fig. 3. Experimental results of single-photon polarization state transmission. (a) Polarization correlations between the local and transmitted photons. The visibilities in the H/V and D/A bases are measured to be 97.1% and 97.8%, respectively. (b) Density matrix of the distributed entangled state. The fidelity with respect to the initial state is 0.977.
Fig. 4. Characterization of chromatic dispersion (CD), group index, and single-photon latency. (a) Measured CDs and group indices of a 20 cm long CTF and a 5 cm long SMF using a free-space Mach–Zehnder interferometer. δ = 0.466 ± 0.003 36.4 ± 0.1 m
Fig. 5. Simulated MF overlapping coefficients with (a) glass and (b) interface for our CTF. The fundamental core modes with the two polarizations are calculated.
Fig. 6. Simulated (a) effective indices and (b) confinement losses of different orders of modes.
Fig. 7. Comparison of experimentally measured and numerically calculated losses of our CTF.
Fig. 8. (a) Measured fidelities and purities of the six single-photon polarization states after transmission through a 36.4 m SMF. Error bars represent one standard deviation. (b) Process matrix (χ m n
Fig. 9. (a) Measured fidelities and purities of the six single-photon polarization states after a 65.5 m CTF using weak coherent source. Error bars represent one standard deviation. (b) Process matrix (χ m n
|
Table 1. Comparison of Mode Field Overlaps of Four Different HCFs

Set citation alerts for the article
Please enter your email address
© Copyright 2018-2021 | Chinese Laser Press. All Rights Reserved 沪ICP备15018463号-20