
J. E. Hirsch, F. Marsiglio. Clear evidence against superconductivity in hydrides under high pressure[J]. Matter and Radiation at Extremes, 2022, 7(5): 058401
- Matter and Radiation at Extremes
- Vol. 7, Issue 5, 058401 (2022)
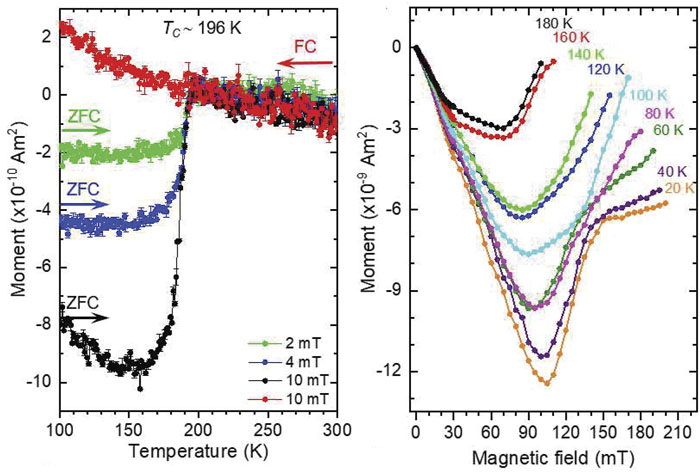
Fig. 1. Left panel: Magnetization of sulfur hydride vs temperature reported in Ref. 29 , under field cooling (FC) and zero-field cooling (ZFC). Right panel: Magnetization of sulfur hydride vs applied magnetic field reported in Ref. 29 . Reproduced with permission from Minkov et al. , Nat. Commun. 13 , 3194 (2022). Copyright 2022 Author(s), licensed under a Creative Commons Attribution 4.0 License.
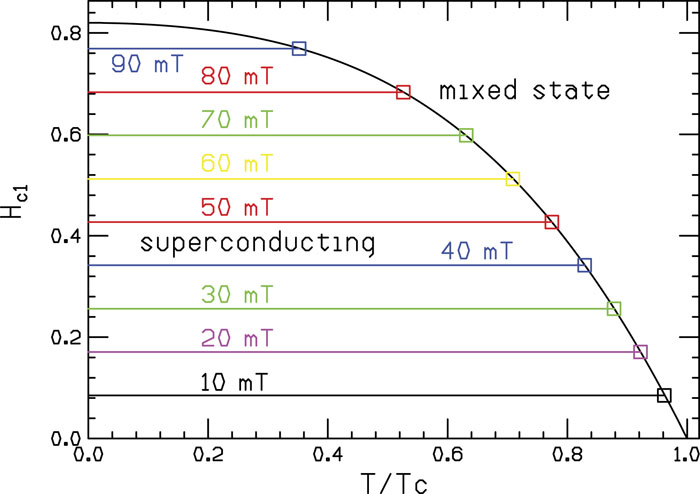
Fig. 2. Lower critical field vs temperature for a standard superconductor according to Ginzburg–Landau theory. The zero-temperature critical field is 0.82 T. The numerical values of the field given in mT indicate the applied field H p , which becomes H c 1 = 8.5H p due to the demagnetization factor 1/(1 − N ) for N = 0.88 reported in Ref. 29 .
Fig. 3. Magnetic moment vs temperature inferred from the experimental results of Ref. 29 shown in Fig. 1 , for various values of the applied magnetic field H p given in mT on the figure. The colored squares indicate the point on the curve for the applied magnetic field that corresponds to the critical temperature given by the phase boundary in Fig. 2 .
Fig. 4. Top and bottom panels: Middle left and lower left panels, respectively, of Fig. S1 of Ref. 29 . The bottom panel corresponds to the precursor sample and the top panel to the assumed superconducting sample. See the text for discussion. Reproduced with permission from Minkov et al. , Nat. Commun. 13 , 3194 (2022). Copyright 2022 Author(s), licensed under a Creative Commons Attribution 4.0 License.
Fig. 5. Magnetic moment vs temperature for sulfur hydride under field-cooled (red points) and zero-field-cooled (black points) conditions for three different runs performed in 2015, reported in Ref. 1 in 2015 and in Fig. 5(a) of Ref. 31 (left panel), in Fig. 5(b) of Ref. 31 (center panel), and in Fig. 6(a) of Ref. 31 (right panel). Reproduced with permission from Eremets et al. , J. Supercond. Novel Magn. 35 , 965 (2022). Copyright 2022 Author(s), licensed under a Creative Commons CC BY license.
Fig. 6. Upper panel: Alleged signature of the Meissner effect upon field cooling indicated by the blue line, from Fig. 5(h) of Ref. 31 . Reproduced with permission from Eremets et al. , J. Supercond. Novel Magn. 35 , 965 (2022). Copyright 2022 Author(s), licensed under a Creative Commons CC BY license. Lower panel: The same picture with the blue line removed, i.e., we have simply replaced the blue line by less distracting red points and white background that now hide the blue line. We have also removed some distracting black points. All the remaining black points should be ignored—they correspond to ZFC measurements. There is no apparent transition as a function of temperature indicated by the red points in the lower panel.
Fig. 7. The first two rows show the expected behavior of standard superconductors. The first row shows complete flux expulsion, as occurs in clean type I superconductors or type II superconductors with weak pinning centers. The second row shows small or zero Meissner fraction, as occurs in superconductors with many defects/strong pinning centers that trap magnetic field. When the external field is removed, the trapped field remains. Of course, behavior intermediate between those shown in the first and second rows is possible and in fact is most common, namely, some of the flux is expelled and some is trapped when the external field is removed. The third row shows the behavior of normal metals and of hydride superconductors (as far as we know to date): they neither expel magnetic field nor trap it.


Set citation alerts for the article
Please enter your email address

© Copyright 2018-2021 | Chinese Laser Press. All Rights Reserved 沪ICP备15018463号-20