
J. E. Hirsch, F. Marsiglio. Clear evidence against superconductivity in hydrides under high pressure[J]. Matter and Radiation at Extremes, 2022, 7(5): 058401
- Matter and Radiation at Extremes
- Vol. 7, Issue 5, 058401 (2022)
Abstract
I. INTRODUCTION
The era of high-temperature superconductivity in hydrides under high pressure was spawned by the reported 2015 discovery by Eremets and co-workers1,2 of superconductivity in sulfur hydride, with a critical temperature of 203 K, which was higher than any previously known critical temperature. Since then, it has been reported that superconductivity at high temperatures occurs also in 11 other hydrides under pressure.3–5 These experimental works are strongly motivated and guided by theoretical predictions of superconductivity in these materials based on the conventional BCS electron–phonon theory of superconductivity.6–9
By contrast, we have recently argued that the experimental evidence presented so far does not provide conclusive proof of superconductivity in any of these materials.10–22 Others have also questioned experimental23–25 and theoretical26,27 evidence for superconductivity in some of these materials. Therefore, the very existence of high-temperature superconductivity in hydrides under pressure is now in doubt.28
In their initial paper,1 Eremets and co-workers presented magnetic evidence of superconductivity in sulfur hydride, which was questioned in Ref. 13. Recently, Minkov and co-workers provided new magnetic evidence for superconductivity in sulfur hydride as well as in lanthanum hydride,29,30 and argued that it provides definitive evidence for superconductivity. Eremets et al. provided further arguments and experimental results in Ref. 31. On the contrary, we argue in this paper that, in our opinion, these new measurements together with the old measurements provide convincing evidence against the existence of superconductivity in these hydrides.
II. COMPARISON OF OLD AND NEW MAGNETIC EVIDENCE FOR SUPERCONDUCTIVITY IN SULFUR HYDRIDE
To have confidence that experimental results reflect true physics of the material being studied, it is essential that measurements be reproducible, not only within one laboratory and experimental group but also in different settings. Unfortunately, no other group has reported measurements of magnetization in sulfur hydride (or any other hydride) under high pressure.
According to the experimental results on sulfur hydride reported by the Eremets group in 20151 and 2021,29,30 the critical temperatures were 203 and 196 K, respectively, i.e., very close to one another. The sizes of the samples used were also reported to be similar, with diameters of ∼80 µm in Ref. 1 and 85 µm in Ref. 29 and thicknesses of “a fewμm” in Ref. 1 and between 2.1 and 3.1 µm in Ref. 29. However, the measured magnetic moments of the samples under an applied magnetic field of the same magnitude differed by a factor of five, with the 2015 sample having the larger magnetic moment. No explanation for this large discrepancy is given in Ref. 29. These magnetic moments were measured not by field cooling (FC) but by applying a magnetic field to an already cold sample, and for sufficiently small fields so that the field should not penetrate the sample, and hence such large differences are not expected for samples of similar sizes.
More importantly, the magnitude of the lower critical field reported in 20151 was 30 mT, whereas the same quantity was reported in 2021 to be 1.9 T30 and subsequently 0.82 T,29 which represent differences of a factor of 60 and 27, respectively, from the value six years previously.
The magnitude of the London penetration depth was reported to be 125 nm in 20151 and between 18 and 23 nm in 2021,29 a difference of a factor of five.
Thus, for the past seven years, the physics community has been asked to believe that sulfur hydride has been proven to be a 203 K superconductor based on magnetic measurements that are wrong by these very significant factors. The magnetic evidence reported by Eremets and co-workers in 20151 was regarded by many to be the strongest evidence that hydrides under pressure are high-temperature superconductors. Now, these authors themselves are telling us that that evidence was flawed.29 In other words, the entire edifice of high-temperature superconductivity in pressurized hydrides has been built on dubious foundations.
III. MAGNETIC EVIDENCE IN 2021
It is also remarkable that after the reported magnetization measurements in 2015 using a specially designed miniature nonmagnetic diamond anvil cell (DAC) that could accommodate a superconducting quantum interference device (SQUID) magnetometer,1 no new experimental results using that sophisticated apparatus and technique were reported for a full six years, either by the authors of Ref. 1 or by anybody else. Yet during those years, about 30 new reports of high-temperature superconductivity in 12 different pressurized hydrides were published.3–5
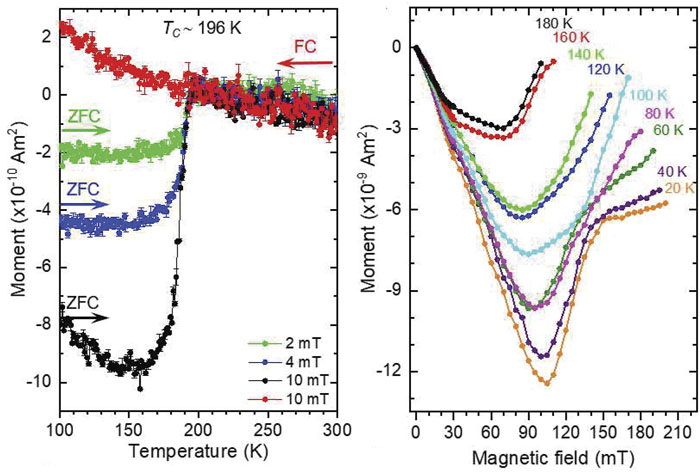
Let us fast forward to 2021.29,30Figure 1 shows in its left panel the reported magnetization vs temperature under an applied magnetic field, and in its right panel the magnetization vs magnetic field for various values of the temperature.29 No evidence of a superconducting transition can be seen under field cooling in the left panel. While this behavior has been observed in some strongly type II superconductors,32,33 it has never been observed in type I or weakly type II superconductors, to our knowledge. According to Ref. 29, this material is a weakly type II superconductor, with Ginzburg–Landau parameter κ = 12. The reported London penetration depth is remarkably small, 22 nm, indicating that the material has a large superfluid density and small degree of disorder. Such materials always exhibit a robust Meissner effect, i.e., magnetic flux expulsion. We argue that the fact that this material does not show any evidence of magnetic field expulsion under field cooling—the signature of superconductivity—is clear and direct evidence that the material is not a superconductor.
![]()
Figure 1.Left panel: Magnetization of sulfur hydride vs temperature reported in Ref.
According to Ref. 29, the sample was a flat disk with demagnetization factor N = 0.88. From this information, and from the observation that a magnetic field at low temperatures of magnitude Hp ∼ 96 mT starts to penetrate the sample, it follows that the lower critical field of sulfur hydride is Hc1(T = 0) = 0.82 T. In Fig. 2, we plot the behavior of the lower critical field of a standard superconductor as a function of temperature inferred from Ginzburg–Landau theory. The horizontal lines show the values of the lower critical field Hc1 for the values of applied field indicated, Hp = 10, 20 mT, etc. The square symbols indicate the critical points for each value of the applied magnetic field.
![]()
Figure 2.Lower critical field vs temperature for a standard superconductor according to Ginzburg–Landau theory. The zero-temperature critical field is 0.82 T. The numerical values of the field given in mT indicate the applied field
For each value of the magnetic field, for temperatures lower than that critical value, the magnetic field should be completely excluded from the sample, except for the small region within λL of the surface. If the penetration depth is 22 nm and the sample diameter and height are 85 and 2.8 µm, respectively, this implies that 99% of the sample remains field-free except very close to the critical temperature. Therefore, we expect the magnetization vs temperature to be essentially flat below each critical temperature. This is approximately consistent with what is seen for the three curves shown in the left panel of Fig. 1. For those values of the applied field, Hp = 2, 4, and 10 mT, the critical temperatures are 194.4, 192.8, and 187.8 K, all close to the zero-field critical temperature 196 K.
From the reported values of magnetic moment vs magnetic field shown in the right panel of Fig. 1 we can extract the behavior of magnetic moment vs temperature for applied fields larger than the values shown on the left panel of Fig. 1. This is shown in Fig. 3. The value of the abscissa for each square is the critical temperature for each value of the applied field inferred from Fig. 2, and we would expect the magnetic moment to be approximately constant for temperatures lower than those values, since the magnetic field is completely excluded from the sample. The behavior seen in Fig. 3 is qualitatively different from this expectation.
![]()
Figure 3.Magnetic moment vs temperature inferred from the experimental results of Ref.
Indeed, it can be seen in Fig. 3 that the sample is unaware of the fact that it underwent a superconducting transition at its critical temperature, denoted by the square on each curve. The magnetization in each case (except for the selected ones that the authors of Ref. 29 chose to show us on the left panel of Fig. 1, also reproduced in Fig. 3), continues its downward trend as the temperature is lowered further, oblivious to the fact that the magnetic field is no longer in its interior. This could be interpreted as revealing yet another new property of nonstandard superconductors11 not shared by standard conventional or unconventional superconductors: an ability to change the magnetic field in their surroundings while keeping the magnetic field in their interior constant (namely, zero).
In the foregoing, we have assumed the value of Hc1 = 0.82 T for sulfur hydride inferred by Minkov et al. in Ref. 29 from the magnetization data shown in the right panel of Fig. 1. They used the widely accepted criterion that Hc1 is the value of the applied field where the magnetization vs H starts to deviate from linearity34 owing to vortex penetration into the superconductor, and an estimated demagnetization factor N ∼ 0.88 [1/(1 − N) = 8.5]. There are however, a variety of reasons why the value Hc1 = 0.82 T could change, as we now discuss.
IV. ENORMOUS Hc1 AND DENSITY OF STATES
In Ref. 12, in connection with an analysis of a nuclear resonant scattering (NRS) experiment on sulfur hydride,40 we pointed out that a lower critical field Hc1 ∼ 2.6 T, a thermodynamic critical field Hc ∼ 10.6 T, and a London penetration depth λL = 10.0 nm are completely incompatible with the physics of standard superconductors. Those values are remarkably close to the values Hc1 = 1.9 T, Hc = 9.8 T, and λL = 12.7 nm inferred in Ref. 30.
Taking into account the range of values of parameters suggested in Refs. 29–31, let us assume for example that owing to uncertainty in the dimensions of the sample, the demagnetizing factor is N = 0.8 instead of the N = 0.88 or N = 0.95 assumed by Minkov et al. in Refs. 29 and 30, respectively. This then yields Hc1 = 0.48 T, Hc = 4.1 T, and λL = 20.4 nm as an alternative to the values assumed by Minkov et al.,29,30 with an Hc1 even lower than the range 0.74–1.09 T estimated in Ref. 29, thus allowing for the possibility that some of the other effects discussed at the end of Sec. III could artificially increase the apparent value of Hc1.
Let us start by computing the critical current. For the value Hc1 = 1.9 T estimated for sulfur hydride in Ref. 30, a magnetic field of magnitude smaller than 1.9 T should be completely excluded from the interior of a long cylinder. The current density circulating near the surface is according to London’s equation,
Instead, Refs. 29 and 30 estimated a value of the critical current density
The density of states at the Fermi energy, g(ϵF), can be obtained from the standard thermodynamic relation
In Ref. 12, we discussed in more detail why such numbers are incompatible with standard superconductivity. Barring a qualitatively different superconducting state unlike that of all known superconductors, this implies, in our opinion, that the properties measured in Ref. 30 interpreted to “unambiguously confirm superconductivity” in fact indicate that the material that was measured was not a superconductor.
The analysis discussed above for sulfur hydride applies equally well to the measurements for LaH10 reported in Ref. 29. It is claimed that for LaH10, the zero-temperature lower critical field, thermodynamic critical field, and London penetration depth are Hc1 = 0.55 T, Hc = 5.1 T, and λL = 30 nm,29 which are comparable to the values reported for H3S (Hc1 = 0.82 T, Hc = 5.5 T, and λL = 22 nm) and equally impossible.
V. SAMPLE QUALITY
The samples were prepared by pulsed laser heating of a precursor containing NH3BH3 as a source of hydrogen and either S or LaH3. The precursor was then heated by traversing a 5 µm laser spot horizontally and vertically across the sample. The fact that the laser spot was much smaller than the estimated diameters of the sample suggests that the resulting sample cannot possibly be a single crystal. Instead, there are likely to be many different regions of the sample of size of order of the laser spot that are connected by weak links63 that would also give rise to pinning centers that could explain the absence of magnetic flux expulsion upon cooling. It would be beneficial for a better understanding if a detailed mapping of the variations of structure within the sample could be performed (see, e.g., Ref. 42).
VI. A SMOKING GUN?
Adding to the arguments presented in the preceding sections, we argue that Fig. S1 of Ref. 29 is a smoking gun that provides clear evidence for the faulty analysis and conclusions of that paper.
In Fig. 4, the bottom panel (i.e., the lower left panel of Fig. S1) shows the measured magnetic moment vs temperature under an applied magnetic field of 2 mT for the sample precursors, namely, S + NH3BH3 before they underwent the laser heating process that generated the supposedly superconducting sample. The zero-field cooling (ZFC) and field cooling (FC) curves approximately coincide for temperatures above 200 K and diverge below 200 K, with the ZFC magnetic moment decreasing and the FC moment increasing as the temperature is further lowered. Precisely the same behavior, attributed to superconductivity, is observed in the sample after heating, shown in the top panel of Fig. 4 (i.e., the middle left panel of Fig. S1) and in the left panel of Fig. 1 (red and green curves, after subtraction of the background signal from the diamond anvil cell).
![]()
Figure 4.Top and bottom panels: Middle left and lower left panels, respectively, of Fig. S1 of Ref.
How does the precursor sample know that the critical temperature of the superconducting sample will be close to 200 K? Why does an applied magnetic field give rise to a different magnetization for the non-superconducting sample under FC and ZFC, also seen in the lower middle and right panels of Fig. S1 of Ref. 29 for other values of the applied magnetic field?
The authors attribute the difference in the FC and ZFC curves shown in Fig. S1 to “contamination by magnetic pieces” (Refs. 29 and 64). Clearly, such effects, which will not necessarily have the same temperature dependence before and after heating, and hence cannot be simply subtracted out, could also be responsible for the signals interpreted as superconductivity.
We argue that the observed behavior in the lower panels of Fig. S1 of Ref. 29, which obviously is not indicative of superconductivity, but clearly is due to experimental artifacts or properties of the background, strongly suggests that the similar divergence of FC and ZFC curves seen for the samples after heating, interpreted as being due to superconductivity, could also be caused by the same experimental artifacts or properties of the background.
VII. EREMETS et al. 2022: “EXPERIMENTAL EVIDENCE AND DETAILS”
In Ref. 31, Eremets and co-workers describe in greater detail the experiments that in their view reveal high-temperature superconductivity in hydrides under high pressure. Here, we address several of the points made in that paper posted in January 2022, more than seven years after the announced discovery of high temperature superconductivity in sulfur hydride.1,2
In the introduction of Ref. 31, the authors argue that nuclear resonant scattering (NRS) experiments,40 infrared spectroscopy,43 and ac susceptibility measurements44 have supported the existence of superconductivity. We have provided elsewhere detailed arguments for why those experiments were flawed.12,14,16,18 The authors of Ref. 31 ignore the issues that we raised in those references. In particular, they state in connection with Ref. 40 that “it appears that the nuclear resonance scattering is a new, non-trivial, and sophisticated technique to detect superconductivity. Hopefully it will find further use to study novel near room-temperature superconductors in difficult conditions, such as ultra-high pressure, and, perhaps in compounds exhibiting superconductivity even above room temperature.” We point out that it is peculiar that in the ensuing six years since Ref. 40 was published, not a single experiment using this technique has been reported, either for a hydride or for any other suspected or confirmed superconductor. Nor was that technique ever used to detect the Meissner effect of any superconductor before the experiment reported in Ref. 40.
Figure 5 shows measurements of the magnetic moment of sulfur hydride vs temperature by the Eremets group around the year 2015. The left panel was published in the 2015 paper,1 but the center and right panels remained unpublished until 2022.31 The left panel suggests a transition to superconductivity, and the magnetic moment changes from positive to negative as expected for a superconducting transition. Instead, in the center and right panels, the magnetic moment does not change sign. Additionally, the magnitude of the drop in magnetic moment is a factor of ten smaller in the right panel compared with the left panel. In the center panel, the drop in magnetic moment occurs over a temperature interval of about 100 K, compared with a temperature interval of about 20–30 K for the left and right panels. Over that interval, the drop in magnetic moment in the center panel is a factor of five smaller than in the left panel.
![]()
Figure 5.Magnetic moment vs temperature for sulfur hydride under field-cooled (red points) and zero-field-cooled (black points) conditions for three different runs performed in 2015, reported in Ref.
Why are these three panels so different from each other? The magnitude of the drop in magnetic moment should depend only on sample dimensions, not temperature or pressure, and the sample dimensions for the three cases were presumably similar. The width of the transition should be similar in different experiments, but it is not.
The fact that there are all these differences between the three panels suggests that the behavior observed is not due to superconductivity. Among the three, the left panel, published in 2015, is the one that shows something closer to what is expected for a superconducting transition.
The strongest evidence for magnetic field expulsion under field cooling, i.e., the Meissner effect proper, is provided by the authors of Ref. 31 in their Fig. 5(h). In Fig. 6, we reproduce their Fig. 5(h) in the upper panel, and in the lower panel we show the same figure with the blue line drawn by hand removed. We argue that “the subtle step(s) observed on FC curves” that, according to the authors of Ref. 31, is indicated by the blue line in the upper panel is no longer apparent in the lower panel when the blue line and the arrow are removed.
![]()
Figure 6.Upper panel: Alleged signature of the Meissner effect upon field cooling indicated by the blue line, from Fig. 5(h) of Ref.
Regarding sample dimensions, Eremets et al. in 202231 start in their introduction by informing readers that “the typical size of samples residing in a diamond anvil cell (DAC) is necessarily small—of the order of ∼50 µm in lateral dimensions.” The word “necessarily” in this context is misleading.
The maximum pressure that can be achieved in a DAC is a function of the culet dimensions.45 This is discussed for example in Ref. 46 and references therein. In their 2015 paper,1 Eremets and co-workers reportedly used “a culet of 40–80 µm” and reported measurements in the range 100–200 GPa. In their 2021 paper,29 they reported using culet sizes of ∼75 and ∼90 µm and pressures of up to 167 GPa.
Although for the higher pressures the smaller culet may be necessary, superconductivity was reportedly detected in Ref. 1 at around 120 GPa. Such a pressure can be easily achieved with a 200 µm culet and possibly even a larger one.46 Such culets should allow for sample diameters much larger than the ∼50 µm that Eremets et al. tell us in 2022 are the sizes of the “tiny samples” that necessarily have to be used. If the samples were not so “tiny” but instead closer to 200 µm in diameter or even larger and correspondingly thicker, it should be much easier to unambiguously demonstrate a magnetic signature of superconductivity if it existed.
Regarding other measurements, particularly resistance, the 2022 paper by Eremets et al.31 states: “H3S was independently synthesized and superconductivity was fully confirmed.”12–16 With regard to this, we make the following remarks:
We argue that the above calls the statement of “fully confirmed” made in Ref. 31 based on its Refs. 12–16 into question.
Finally, we would like to comment on the implication of the following paragraph of the 2022 paper by Eremets et al.,31 reproduced here in full:
“For a long time we did not clearly appreciate the role played (by) the quality and integrity of the samples. Even when the sample has a large enough size and clearly shows superconductivity in electrical transport measurements, the magnetic susceptibility signal can turn out to be elusive or below the sensitivity of the SQUID magnetometer. The reason for that can be the granular or non-uniform distribution of the superconducting phase in samples. The electrical current finds a continuous path through superconducting grains and metallic grain boundaries in the transport measurements whereas much smaller thin superconducting grains have a relatively small superconducting volume leading to a smaller signal due to the demagnetizationfactor.”
The authors explicitly acknowledge that current circulating through “metallic grain boundaries” providing “a continuous path” can be interpreted as showing superconductivity in their experiments. If their superconducting grains have a “relatively small superconducting volume” compared with the total volume, this implies that a significant part of the path through which the current circulates is metallic and not superconducting. If the current necessarily has to go through metallic grain boundaries, which necessarily have nonzero resistance, then the material cannot sustain a persistent current and cannot possess macroscopic phase coherence. We argue that a material that cannot exhibit these defining features of superconductivity cannot be called a superconductor, irrespective of how small its resistance is or how much its resistance depends on the ionic mass.
VIII. A LITMUS TEST FOR HOT HYDRIDE SUPERCONDUCTIVITY
We have proposed in Ref. 14 that detection of trapped flux would provide convincing evidence for the existence of persistent currents in these materials. It would appear that to do this test would not be more difficult than to perform the measurements reported in Refs. 1 and 29.
To rationalize the complete absence of flux expulsion upon field cooling seen in the left panel of Fig. 1, one could hypothesize that there is a large concentration of defects that trap the magnetic field and prevent it from being expelled, even at the large cost of condensation energy implied by the very large Hc. Let us entertain that possibility. If, after the FC process shown in the left panel of Fig. 1, for an applied magnetic field smaller than Hc1, the applied field is turned off, those defects should prevent the interior magnetic field from decaying, and a remnant magnetization should be detectable for several hours, days, or months thereafter. As shown in Refs. 51 and 52, the remnant magnetic moment should be given approximately by the difference in the FC and ZFC moments for the same magnetic field.
So far, there have not been any experimental reports that trapped flux, persisting for a long time, has been detected in hydrides. This is in contrast to what happened with the cuprates, where from the very beginning it was seen that samples that did not strongly expel magnetic fields trapped magnetic fields and this was considered independent evidence for superconductivity.53 The current situation for hydrides is depicted in Fig. 7. Standard superconductors, conventional and unconventional, are described by the extreme behaviors shown in the first and second rows of Fig. 7, as well as behavior intermediate between them, i.e., part of the flux is expelled upon cooling, and the part that is not expelled remains trapped after the external field is removed. Thus far, hydride superconductors, and non-superconductors, are described by the third row: none of the flux is expelled upon field cooling, and none is trapped when the external field is removed.
![]()
Figure 7.The first two rows show the expected behavior of standard superconductors. The first row shows complete flux expulsion, as occurs in clean type I superconductors or type II superconductors with weak pinning centers. The second row shows small or zero Meissner fraction, as occurs in superconductors with many defects/strong pinning centers that trap magnetic field. When the external field is removed, the trapped field remains. Of course, behavior intermediate between those shown in the first and second rows is possible and in fact is most common, namely, some of the flux is expelled and some is trapped when the external field is removed. The third row shows the behavior of normal metals and of hydride superconductors (as far as we know to date): they neither expel magnetic field nor trap it.
If such a trapped flux is detected for a hydride sample in the future, and it is not detected when the same process is performed for the precursor sample before heating, this will provide convincing evidence that persistent currents flow in the material in the absence of an applied magnetic field. Then, the unlikely possibility that these materials are “nonstandard superconductors”11,12 will have to be seriously considered. Conversely, if no field trapping is observed, this will provide strong confirmation of our arguments that indicate that these systems are not superconducting.
Similarly, we have suggested14 that in an NRS experiment40 that claimed to show flux exclusion from sulfur hydride from the absence of quantum beats in the NRS spectra under an applied magnetic field, it would be straightforward to verify the presence of trapped field by showing that quantum beats are present after field cooling and removal of the external field.
IX. SUMMARY AND CONCLUSIONS
The magnetic measurements reported in Refs. 29–31 were intended to establish that hydrides under pressure are indeed high-temperature superconductors. Reference 30 claimed to present unambiguous (three times) and definitive (once) evidence for high-temperature superconductivity in sulfur hydride and lanthanum hydride under pressure. Reference 31 claims to have presented “very solid evidence for high-temperature superconductivity in hydrogen-rich compounds under high pressures.” In this paper, we have argued that, instead, these recent experimental papers29–31 not only have not established that these hydrides are superconductors, but rather they have increased the likelihood that they are not. The papers provide a snapshot of where the field is today, more than seven years after the reported discovery of this new class of superconducting materials. Compare this snapshot with a snapshot of where the field of any other new class of superconducting materials that withstood the test of time was seven years after its discovery, particularly those with higher Tc. It is precisely because only a few researchers can perform these difficult high-pressure experiments that the onus is on them to provide convincing evidence for superconductivity.
Let us summarize our conclusions.
Conclusions 1–4 are based on our assumption, consistent with the conclusions of the authors of Refs. 29–31 inferred from the magnetization data, with which we agree, that the lower critical field in these materials, if they are superconductors, is of order 0.5 T or larger. If, instead, the critical field were one to two orders of magnitude smaller, these conclusions would be invalidated. We do not believe that this is plausible, given the magnetic evidence discussed.
It should also be pointed out that Ref. 29 states in the caption of its Fig. 2 “Expulsion of magnetic field by the superconducting Im-3m-H2SandFm-3m-LaH10phases …” when in fact the figure shows no evidence for magnetic field expulsion. Reference 30 misleadingly claimed, even in its title, that “the Meissner effect” was demonstrated, The fact is the Meissner effect is magnetic field expulsion, not magnetic field exclusion. Magnetic field exclusion was known to researchers in 1911, magnetic field expulsion was only discovered in 1933. References 29–31 presented zero evidence for magnetic field expulsion. Similarly, Ref. 40 claimed to report “direct observation of the expulsion of the magnetic field” from sulfur hydride, when in fact no field cooling was even performed.
The experiments reported in Refs. 29 and 31 were performed under very difficult experimental conditions, at very large pressures and with very small samples, and a variety of effects unrelated to the physics of the sample but instead due to properties of the background or the experimental apparatus could come into play. Under such challenging conditions, we suggest that it is very important to guard against confirmation bias, the tendency to pay undue attention to observed features that confirm prior beliefs and ignore others that do not. While we recognize that it may be very difficult to obtain clear evidence of a Meissner effect in a very small sample, we point out that as discussed in Ref. 14, a rather large remnant magnetic moment should remain trapped in the samples after field cooling in a large magnetic field if one is to believe the NRS experiment;40,54 no such observation has been reported so far. We do not know what could be the origin of the features found in the experiments that are attributed to be superconductivity by Eremets et al., but we have argued in this paper that in our opinion they are inconsistent with superconductivity.
In other recent papers, we have analyzed various other reported pieces of evidence for superconductivity in pressurized hydrides and have concluded that every experiment was flawed:
To extract Hc1 from magnetization data is a notoriously difficult task,38,61,62 and, as discussed at the end of Sec. III, other effects not considered in Refs. 29 and 31 could play a role to reduce the value of Hc1 somewhat. However, we believe it is extremely unlikely that such a reduction would be of the magnitude necessary to invalidate our conclusions in this paper, namely, one to two orders of magnitude.
The field of high-temperature superconductivity in hydrides was launched in 2015 by the publication of Ref. 1 by Eremets and co-workers. Now, the same author and co-workers have presented evidence29–31 that (a) invalidates the evidence for superconductivity presented in the 2015 paper and (b) is in itself flawed, as discussed in this paper. From this, together with our analysis of the totality of magnetic evidence and other experimental evidence for superconductivity in hydrides discussed in our earlier papers, we argue that the most likely conclusion is that hydrides under pressure are not high-temperature superconductors. Whatever the origin of their anomalous behavior is whether intrinsic or due to experimental artifacts or both, in our opinion it is not due to superconductivity.
ACKNOWLEDGMENTS
Acknowledgment. We are grateful to D. Semenok for calling our attention to Ref. 30, to V. S. Minkov, S. L. Bud’ko, and M. I. Eremets for clarifying correspondence on their papers, and to V. Struzhkin and R. Prozorov for discussions. J.E.H. would like to thank S. Shylin for extensive discussions and sharing of information on Refs. 1 and 31. F.M. was supported in part by the Natural Sciences and Engineering Research Council of Canada (NSERC), and by an MIF from the Province of Alberta.
References
[1] A. P.Drozdov, M. I.Eremets, V.Ksenofontov, S. I.Shylin, I. A.Troyan. Conventional superconductivity at 203 kelvin at high pressures in the sulfur hydride system. Nature, 525, 73-76(2015).
[3] D. V.Semenok et al. On distribution of superconductivity in metal hydrides. Curr. Opin. Solid State Mater. Sci., 24, 100808(2020).
[4] G.Gao et al. Superconducting binary hydrides: Theoretical predictions and experimental progresses. Mater. Today Phys., 21, 100546(2021).
[5] X.Zhang et al. Pressure-induced hydride superconductors above 200 K. Matter Radiat. Extremes, 6, 068201(2021).
[6] K.Bennemann, J.Carbotte, F.Marsiglio, and K.Bennemann, J.Ketterson. Superconductivity, 73(2008).
[7] M. I.Eremets, I.Errea, C. J.Pickard. Superconducting hydrides under pressure. Annu. Rev. Condens. Matter Phys., 11, 57(2020).
[8] J. A.Flores-Livas et al. A perspective on conventional high-temperature superconductors at high pressure: Methods and materials. Phys. Rep., 856, 1(2020).
[9] B.Lilia et al. The 2021 room-temperature superconductivity roadmap. J. Phys.: Condens. Matter, 34, 183002(2022).
[11] J. E.Hirsch, F.Marsiglio. Nonstandard superconductivity or no superconductivity in hydrides under high pressure. Phys. Rev. B, 103, 134505(2021).
[12] J. E.Hirsch, F.Marsiglio. Meissner effect in nonstandard superconductors. Physica C, 587, 1353896(2021).
[13] J. E.Hirsch, F.Marsiglio. Absence of magnetic evidence for superconductivity in hydrides under high pressure. Physica C, 584, 1353866(2021).
[14] J. E.Hirsch, F.Marsiglio. Flux trapping in superconducting hydrides under high pressure. Physica C, 589, 1353916(2021).
[15] J. E.Hirsch, F.Marsiglio. Unusual width of the superconducting transition in a hydride. Nature, 596, E9(2021).
[17] J. E.Hirsch. About the pressure-induced superconducting state of europium metal at low temperatures. Physica C, 583, 1353805(2021).
[18] J. E.Hirsch. Faulty evidence for superconductivity in ac magnetic susceptibility of sulfur hydride under pressure. Natl. Sci. Rev., 9, nwac086(2022).
[20] J. E.Hirsch. Disconnect between published ac magnetic susceptibility of a room temperature superconductor and measured raw data. Preprints, 2021, 2021120115(2021).
[21] J. E.Hirsch. Comment on ‘Room-temperature superconductivity in a carbonaceous sulfur hydride’ by Elliot Snider
[23] M. L.Cohen, M.Dogan. Anomalous behavior in high-pressure carbonaceous sulfur hydride. Physica C, 583, 1353851(2021).
[24] E. F.Talantsev. The electron-phonon coupling constant, Fermi temperature and unconventional superconductivity in the carbonaceous sulfur hydride 190 K superconductor. Supercond. Sci. Technol., 34, 034001(2021).
[26] T.Wang et al. Absence of conventional room-temperature superconductivity at high pressure in carbon-doped H3S. Phys. Rev. B, 104, 064510(2021).
[27] M.Gubler et al. Missing theoretical evidence for conventional room temperature superconductivity in low enthalpy structures of carbonaceous sulfur hydrides. Phys. Rev. Mater., 6, 014801(2022).
[28] Y.Ding, H.-K.Mao, D.Wang. Future study of dense superconducting hydrides at high pressure. Materials, 14, 7563(2021).
[29] V. S.Minkov et al. Magnetic field screening in hydrogen-rich high-temperature superconductors. Nat. Commun., 13, 3194(2022).
[30] V. S.Minkov et al. The Meissner effect in high-temperature hydrogen-rich superconductors under high pressure. Research Square(2021).
[31] M. I.Eremets et al. High-temperature superconductivity in hydrides: Experimental evidence and details. J. Supercond. Novel Magn., 35, 965(2022).
[32] N. M.Nusran et al. Spatially-resolved study of the Meissner effect in superconductors using NV-centers-in-diamond optical magnetometry. New J. Phys., 20, 043010(2018).
[33] A. S.Sefat et al. Superconductivity at 22 K in Co-doped BaFe2As2 crystals. Phys. Rev. Lett., 101, 117004(2008).
[34] C. P.Bean. Magnetization of hard superconductors. Phys. Rev. Lett., 8, 250(1962).
[35] C. P.Bean, J. D.Livingston. Surface barrier in type-II superconductors. Phys. Rev. Lett., 12, 14(1964).
[36] A. S.Joseph, W. J.Tomasch. Experimental evidence for delayed entry of flux into a type-II superconductor. Phys. Rev. Lett., 12, 219(1964).
[37] M.Abdel-Hafiez et al. Determination of the lower critical field
[38] M.Naito et al. Temperature dependence of anisotropic lower critical fields in
[39] M.Reedyk et al. Temperature dependence of the anisotropic magnetic penetration depth and lower critical field of single-crystal Pb2Sr2(Y, CA)Cu3O8+δ. Phys. Rev. B, 44, 4539(1991).
[40] I.Troyan et al. Observation of superconductivity in hydrogen sulfide from nuclear resonant scattering. Science, 351, 1303(2016).
[41] W. P.Crump, E.Talantsev, J. L.Tallon. Thermodynamic parameters of single- or multi-band superconductors derived from self-field critical currents. Ann. Phys., 529, 1700197(2017).
[42] P.Thibault et al. High-resolution scanning X-ray diffraction microscopy. Science, 321, 379(2008).
[43] F.Capitani et al. Spectroscopic evidence of a new energy scale for superconductivity in H3S. Nat. Phys., 13, 859(2017).
[44] X.Huang et al. High-temperature superconductivity in sulfur hydride evidenced by alternating-current magnetic susceptibility. Natl. Sci. Rev., 6, 713(2019).
[45] X.-J.Chen, Y.Ding, B.Li, H.-K.Mao, L.Wang. Solids, liquids, and gases under high pressure. Rev. Mod. Phys., 90, 015007(2018).
[46] E. F. O’Bannon et al. Contributed Review: Culet diameter and the achievable pressure of a diamond anvil cell: Implications for the upper pressure limit of a diamond anvil cell. Rev. Sci. Instrum., 89, 111501(2018).
[47] K.Shimizu et al. Superconductivity and structural studies of highly compressed hydrogen sulfide. Physica C, 552, 27(2018).
[48] K.Shimizu. Investigation of superconductivity in hydrogen-rich systems. J. Phys. Soc. Jpn., 89, 051005(2020).
[49] H.Nakao et al. Superconductivity of pure H3S synthesized from elemental sulfur and hydrogen. J. Phys. Soc. Jpn., 88, 123701(2019).
[50] R.Akashi. Evidence of ideal superconducting sulfur superhydride in a pressure cell. JPSJ News Comments, 16, 18(2019).
[51] A. P.Malozemoff et al. Remanent moment of high-temperature superconductors: Implications for flux-pinning and glassy models. Phys. Rev. B, 38, 6490(1988).
[52] A. K.Grover et al. Thermomagnetic history effects in niobium and its implication for
[53] J. G.Bednorz, K. A.Müller, M.Takashige. Flux trapping and superconductive glass state in La2CuO4−y:Ba. Phys. Rev. Lett., 58, 1143(1987).
[54] S. L.Bud’ko, R.Prozorov. On the analysis of the tin-inside-H3S Mössbauer experiment(2022).
[55] E.Snider et al. Room-temperature superconductivity in a carbonaceous sulfur hydride. Nature, 586, 373(2020).
[56] V.Struzhkin et al. Superconductivity in La and Y hydrides: Remaining questions to experiment and theory. Matter Radiat. Extremes, 5, 028201(2020).
[57] M.Somayazulu et al. Evidence for superconductivity above 260 K in lanthanum superhydride at megabar pressures. Phys. Rev. Lett., 122, 027001(2019).
[58] A. P.Drozdov et al. Superconductivity at 250 K in lanthanum hydride under high pressures. Nature, 569, 528(2019).
[59] D. V.Semenok et al. Superconductivity at 253 K in lanthanum-yttrium ternary hydrides. Mater. Today, 48, 18(2021).
[60] P.Kong et al. Superconductivity up to 243 K in the yttrium-hydrogen system under high pressure. Nat. Commun., 12, 5075(2021).
[61] J.Gutierrez et al. First vortex entry into a perpendicularly magnetized superconducting thin film. Phys. Rev. B, 88, 184504(2013).
[62] V. V.Moshchalkov et al. Anisotropy of the first critical field and critical current in YBa2Cu3O6.9 single crystals. Physica C, 175, 407(1991).
[63] V.Struzhkin(2021).
[64] V.Minkov.


Set citation alerts for the article
Please enter your email address

© Copyright 2018-2021 | Chinese Laser Press. All Rights Reserved 沪ICP备15018463号-20