• Chinese Optics Letters
  • Vol. 20, Issue 2, 021603 (2022)
Wei Wang1, Qinpeng Chen1, Yifei Zhao2, Yakun Le1, Shengda Ye1, Mang Wan3, Xiongjian Huang1、4、*, and Guoping Dong1、**
Author Affiliations
  • 1State Key Laboratory of Luminescent Materials and Devices, Guangdong Provincial Key Laboratory of Fiber Laser Materials and Applied Techniques, Guangdong Engineering Technology Research and Development Center of Special Optical Fiber Materials and Devices, School of Materials Science and Engineering, South China University of Technology, Guangzhou 510640, China
  • 2Department of Chemistry, City University of Hong Kong, Kowloon 999077, Hong Kong, China
  • 3Analytical and Testing Center, South China University of Technology, Guangzhou 510640, China
  • 4School of Physics and Optoelectronics, South China University of Technology, Guangzhou 510640, China
  • show less
    DOI: 10.3788/COL202220.021603 Cite this Article Set citation alerts
    Wei Wang, Qinpeng Chen, Yifei Zhao, Yakun Le, Shengda Ye, Mang Wan, Xiongjian Huang, Guoping Dong. PbS quantum dots and BaF2:Tm3+ nanocrystals co-doped glass for ultra-broadband near-infrared emission [Invited][J]. Chinese Optics Letters, 2022, 20(2): 021603 Copy Citation Text show less
    (a) DSC curves of PG. (b) XRD patterns of PG and glasses heat treated at different temperatures for 10 h. (c) XRD refinement patterns of glass heat treated at 480°C for 10 h.
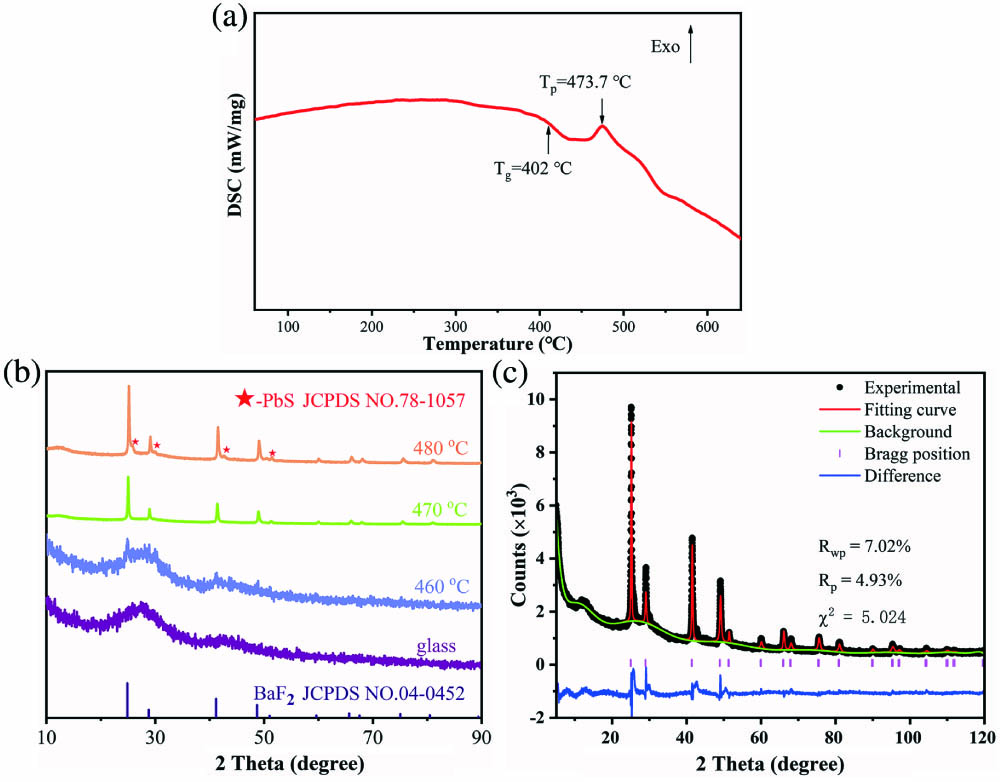
    Fig. 1. (a) DSC curves of PG. (b) XRD patterns of PG and glasses heat treated at different temperatures for 10 h. (c) XRD refinement patterns of glass heat treated at 480°C for 10 h.
    Crystal structure of (a) BaF2 and (b) PbS doped with a Tm3+ ion.
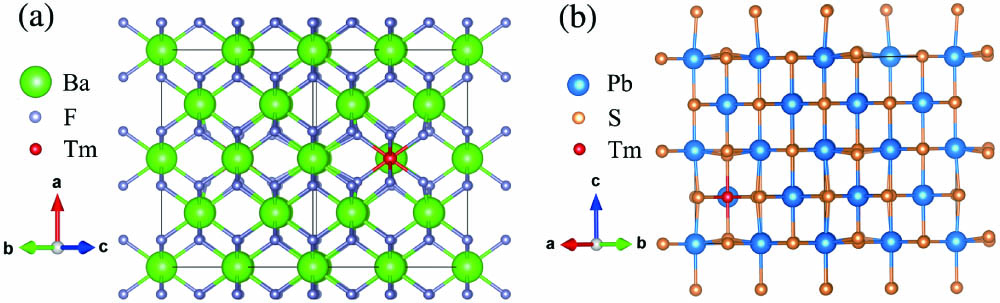
    Fig. 2. Crystal structure of (a) BaF2 and (b) PbS doped with a Tm3+ ion.
    (a) TEM image and (b), (c) HRTEM images of the glass heat treated at 470°C for 10 h. (d) HAADF-STEM image and (e)–(i) the distribution of representative S, Pb, Ba, F, and Tm elements by two-dimensional element mapping of the glass heat treated at 470°C for 10 h.
    Fig. 3. (a) TEM image and (b), (c) HRTEM images of the glass heat treated at 470°C for 10 h. (d) HAADF-STEM image and (e)–(i) the distribution of representative S, Pb, Ba, F, and Tm elements by two-dimensional element mapping of the glass heat treated at 470°C for 10 h.
    Absorption spectra of PG and glasses heat treated at different temperatures for 10 h.
    Fig. 4. Absorption spectra of PG and glasses heat treated at different temperatures for 10 h.
    (a) PL spectra of PG and glasses heat treated at different temperatures for 10 h excited by an 808 nm laser. (b) PL spectra of the glass heat treated at 470°C; PL1 and PL2 are the luminescence bands related to the PbS QDs and Tm3+ ions. (c) Lifetime decay curves of the glass samples. The inset is the enlarged curves. The excitation wavelength is 808 nm, and the emission wavelength is 1810 nm. (d) Power-dependent PL spectra of the glass heat treated at 470°C. The inset is PL intensity of the luminescence bands related to the PbS QDs and Tm3+ ions.
    Fig. 5. (a) PL spectra of PG and glasses heat treated at different temperatures for 10 h excited by an 808 nm laser. (b) PL spectra of the glass heat treated at 470°C; PL1 and PL2 are the luminescence bands related to the PbS QDs and Tm3+ ions. (c) Lifetime decay curves of the glass samples. The inset is the enlarged curves. The excitation wavelength is 808 nm, and the emission wavelength is 1810 nm. (d) Power-dependent PL spectra of the glass heat treated at 470°C. The inset is PL intensity of the luminescence bands related to the PbS QDs and Tm3+ ions.
    (a) Temperature-dependent PL spectra of glass heat treated at 460°C. (b) Temperature dependence of the PbS QDs PL peak position. (c) The FIR of ITm/IQDs as a function of temperature in the range of 310–453 K. (d) The relative sensitivity SR and the absolute sensitivity SA in (c).
    Fig. 6. (a) Temperature-dependent PL spectra of glass heat treated at 460°C. (b) Temperature dependence of the PbS QDs PL peak position. (c) The FIR of ITm/IQDs as a function of temperature in the range of 310–453 K. (d) The relative sensitivity SR and the absolute sensitivity SA in (c).
    ModelTotal Energy (eV)iniμi (eV)Formation energy (eV)
    Perfect BaF2549.2300
    BaF2:Tm550.592.260.91
    Perfect PbS269.9300
    PbS:Tm263.981.087.03
    Table 1. Key Parameters for the Defect Formation Energy Calculation
    Wei Wang, Qinpeng Chen, Yifei Zhao, Yakun Le, Shengda Ye, Mang Wan, Xiongjian Huang, Guoping Dong. PbS quantum dots and BaF2:Tm3+ nanocrystals co-doped glass for ultra-broadband near-infrared emission [Invited][J]. Chinese Optics Letters, 2022, 20(2): 021603
    Download Citation