
Wei Wang, Qinpeng Chen, Yifei Zhao, Yakun Le, Shengda Ye, Mang Wan, Xiongjian Huang, Guoping Dong. PbS quantum dots and BaF2:Tm3+ nanocrystals co-doped glass for ultra-broadband near-infrared emission [Invited][J]. Chinese Optics Letters, 2022, 20(2): 021603
- Chinese Optics Letters
- Vol. 20, Issue 2, 021603 (2022)
Abstract
1. Introduction
With the advent of the big data age, the application of broadband fiber amplifiers has become more and more important[
In recent years, semiconductor quantum dot (QD)-doped glasses with tunable wavelength and broadband emission have attracted much attention[
RE ions and semiconductor QDs are both efficient luminescent materials. Whether the effective combination of them can produce high-efficiency luminescence or laser devices has always been a question to researchers. Meijerink et al.[
Sign up for Chinese Optics Letters TOC. Get the latest issue of Chinese Optics Letters delivered right to you!Sign up now
In this work, -ion- doped nanocrystals (NCs) and PbS QDs were simultaneously precipitated in the glass through post thermal treatment. Different from previous work[
2. Experiments
2.1. Fabrication
The glasses were prepared by the melt-quenching method with a composition of (mole fraction). After being fully mixed, 30 g stoichiometric raw materials were melted at 1100°C for 30 min in a low-temperature furnace. The glass melt was quenched on a preheated stainless-steel plate to form transparent glasses and then transferred to the muffle furnace at 350°C for 3 h to eliminate the inner stress. After the glasses were completely cooled, the precursor glasses (PGs) without QDs and NCs were obtained, then cut into suitable sizes (), and underent heat treatment at 460°C–480°C for 10 h. Afterward, PbS QDs and NCs were formed in the glasses.
2.2. Characterization
The glasses were analyzed by X-ray diffraction (XRD, PANalytical X′pert PRO, Cu Kα, ) to determine the crystal forms in the glass. Transmission electron microscopy (TEM, Tecnai G2, FEI, Amsterdam, the Netherlands) was used to confirm the size, size distribution, and morphology of PbS QDs and NCs. A UV/visible (VIS)/NIR double beam spectrophotometer (Perkin-Elmer Lambda 900, Waltham, MA) was used to measure the absorption spectra of the glasses. An Omni k300 spectrometer (Zolix, China) was utilized to record the fluorescence spectra upon the excitation of an 808 nm LD. The lifetime decay curves of the glass samples were measured by a digital phosphor oscilloscope (TDS3012C, Tektronix, America) and a signal generator. The variable temperature spectrum test was also measured by the Omni k300 spectrometer (Zolix, China) for testing. Orient-KOJI’s TAP-02 high-temperature fluorescence accessory was used as an external device for the spectrometer, and the test range was from room temperature to 453 K.
2.3. Calculation
Theoretical simulations were carried out based on the density functional theory (DFT) and the generalized gradient approximation (GGA) Perdew–Burke–Ernzerhof (PBE) exchange-correlation functional for describing the interactions[
3. Results
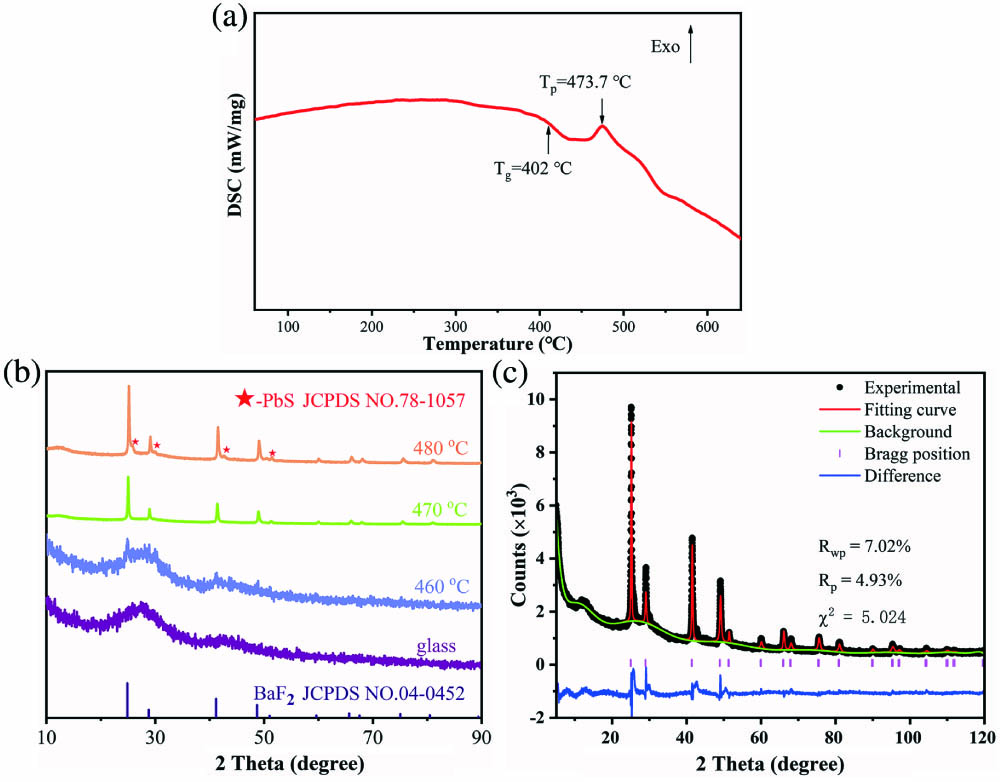
Figure 1(a) shows the differential scanning calorimetry (DSC) curve of the PG. According to the curve, the glass transition temperature () of the PG is 402°C and the exothermic peak at 473.7°C is the crystallization peak () of the PG. Thus, the heat treatment temperature range is set to 460°C–480°C. Figure 1(b) is the XRD pattern of the PG and the glass is heat treated at different temperatures for 10 h. There are only amorphous peaks in the XRD curves of the PG, indicating that there are no crystals in the PG. As the heat treatment temperature increases, sharper diffraction peaks appear at 470°C, and the intensity of the diffraction peaks becomes stronger. The three weak diffraction peaks appearing at 26°, 30°, and 43° in the sample heat treated at 480°C refer to the (111), (200), and (220) crystal planes of the cubic structure of PbS QDs. The other three diffraction peaks appearing at 25°, 29°, and 41° in the sample are ascribed to the (111), (200), and (220) crystal planes of NCs, respectively. According to the Scherrer formula calculation, the average particle size of NCs in the samples heat treated at 470°C and 480°C is about 33.41 nm and 38.59 nm, respectively. It can be observed that the diffraction peaks of NCs heat treated at 480°C shifted to larger angles compared to the standard card. This indicates that ions entered the NCs lattice, resulting in the change of the unit cell parameters. Through refinement of the XRD curve, as shown in Fig. 1(c), it is found that the volume of the crystal () is reduced compared with that of the standard crystal ().
![]()
Figure 1.(a) DSC curves of PG. (b) XRD patterns of PG and glasses heat treated at different temperatures for 10 h. (c) XRD refinement patterns of glass heat treated at 480°C for 10 h.
![]()
Figure 2.Crystal structure of (a) BaF2 and (b) PbS doped with a Tm3+ ion.
To find out why ions tend to enter the NCs instead of PbS QDs, theoretical simulations were then employed to investigate the defect formation energies of ions in or PbS (Fig. 2). A supercell was built based on the pristine lattice of PbS (Fm-3m) and (Fm-3m) before one atom was introduced. The structures were fully relaxed under the same criterion, and the defect formation energy was then calculated by the following equation:
| Model | Total Energy (eV) | Formation energy (eV) | |
|---|---|---|---|
| Perfect | 0 | 0 | |
| 0.91 | |||
| Perfect PbS | 0 | 0 | |
| PbS:Tm | 7.03 |
Table 1. Key Parameters for the Defect Formation Energy Calculation
To further confirm the formation and morphology of crystals in the designed glass samples, the microstructure and element distribution of the glass heat treated at 470°C were studied by TEM measurement, as shown in Fig. 3. It can be seen that two NCs with different sizes are precipitated in the glass sample under 470°C heat treatment, namely 3–4 nm and 32–35 nm, corresponding to the sizes of PbS QDs and NCs in XRD. The high-resolution TEM (HRTEM) image shows that the lattice fringe of the larger crystal is 0.31 nm, which corresponds to the (200) crystal plane of NCs [Fig. 3(b)], and the lattice fringe of the other crystal is 0.21 nm, which corresponds to the (220) crystal plane of PbS QDs [Fig. 3(c)]. To further analyze the distribution of PbS QDs, NCs, and ions in the glass, a two-dimensional elemental mapping analysis was performed on the sample. Due to the smaller size of PbS QDs, only NCs are observed in the strong diffraction region [Fig. 3(d)]. In the strong diffraction region, it can be observed that Ba, F, and Tm elements are more abundantly distributed in the NC region than in the glass phase, which indicates that ions are concentrated around NCs in the glass [Figs. 3(g)–3(i)].
![]()
Figure 3.(a) TEM image and (b), (c) HRTEM images of the glass heat treated at 470°C for 10 h. (d) HAADF-STEM image and (e)–(i) the distribution of representative S, Pb, Ba, F, and Tm elements by two-dimensional element mapping of the glass heat treated at 470°C for 10 h.
Figure 4 shows the absorption spectra of the PG and the heat-treated glass. In the PG, there are four absorption peaks at 686 nm, 794 nm, 1210 nm, and 1690 nm corresponding to the energy level transitions of ions from the ground state to , , , and excited states, respectively. After heat treatment, the glasses have a wider absorption band in the NIR range, especially the glass heat treated at 470°C, which is related to the formation of PbS QDs. As the heat treatment temperature increases, NCs and PbS QDs are gradually precipitated in the glass, the color of the glasses becomes darker, and the absorption rate gradually increases.
![]()
Figure 4.Absorption spectra of PG and glasses heat treated at different temperatures for 10 h.
To explore the luminescent performance of the glass samples, an 808 nm laser was used as the excitation source to measure the NIR emission [Fig. 5(a)]. The emission at 1810 nm is obtained in the PG, which is ascribed to the emission of electrons in the energy state of the metastable state and reaching the ground state . In the heat-treated glass, the emission peak at 1810 nm also appears, which has a significant emission enhancement compared with the PG. This is due to the precipitation of NCs in the glass, which provides a crystal field with lower phonon energy for ions. At the same time, another broadband emission peak can be observed, and, as the heat treatment temperature increases, its emission peak position moves from 1200 nm to 2000 nm. Since the emission peak position of ions is fixed and located at 1810 nm, it can be inferred that the tunable emission originates from the emission of PbS QDs. Due to the quantum confinement effect, as the heat treatment temperature increases, the size of the PbS QDs increases, and the bandgap structure becomes smaller. Thus, the corresponding PL spectrum will be red-shifted. When the glass is heat treated at 470°C, the emission of PbS QDs and ions can combine as an ultra-broadband NIR emission covering 1200–2000 nm with FWHM over 430 nm [Fig. 5(b)]. To further discuss the luminescence mechanism of the glass samples, the fluorescence lifetime was explored, as shown in Fig. 5(c). It can be observed that as the heat treatment temperature increases, the luminescence gradually increases, and the fluorescence lifetime at 1810 nm increases from 0.678 ms to 1.082 ms. Since ions are mainly confined in the NCs, which means that the distance between ions and PbS QDs is larger than that for energy transfer, it is difficult to transfer energy from PbS QDs to ions. Power-dependent photoluminescence (PL) spectra of the glass heat treated at 470°C are shown in Fig. 5(d). It can be observed that the emission of ions at 1810 nm increases with the increase of laser power. When the laser power reaches 2.1 W, the emission intensity from PbS QDs reaches saturation relative to that from ions. With further increase of power, the intensity of PL is relatively reduced, which is due to the thermal quenching of PL intensity.
![]()
Figure 5.(a) PL spectra of PG and glasses heat treated at different temperatures for 10 h excited by an 808 nm laser. (b) PL spectra of the glass heat treated at 470°C; PL1 and PL2 are the luminescence bands related to the PbS QDs and Tm3+ ions. (c) Lifetime decay curves of the glass samples. The inset is the enlarged curves. The excitation wavelength is 808 nm, and the emission wavelength is 1810 nm. (d) Power-dependent PL spectra of the glass heat treated at 470°C. The inset is PL intensity of the luminescence bands related to the PbS QDs and Tm3+ ions.
In practical applications, the influence of ambient temperature on the luminescence of PbS QDs and NCs is of great significance to the design of devices. In Fig. 6, we further explore the temperature-dependent emission of the glass. As the test temperature increases, the luminescence peak of PbS QDs gradually shifts to a longer wavelength [Fig. 6(b)]. There are two main reasons for this phenomenon: electron-phonon coupling and thermal expansion of crystals[
![]()
Figure 6.(a) Temperature-dependent PL spectra of glass heat treated at 460°C. (b) Temperature dependence of the PbS QDs PL peak position. (c) The FIR of ITm/IQDs as a function of temperature in the range of 310–453 K. (d) The relative sensitivity SR and the absolute sensitivity SA in (c).
In the above formula, , are constants, is the thermal-quenching energy level difference of the non-thermal coupling system, is the Boltzmann constant, and is the absolute temperature.
To further measure its absolute temperature performance, it is necessary to evaluate the absolute sensitivity and relative sensitivity , and the expression is as follows:
As shown in Fig. 6(d), it can be seen that in the temperature range of 310–453 K, both and decrease monotonously with increasing temperature. In addition, the relative sensitivity and absolute sensitivity of FIR reach the maximum values of 4.98% and 1.99% at 310 K. The above results show that it also has a good application prospect in the field of optical thermometry.
4. Conclusions
PbS QDs and NCs-doped glasses were fabricated by the melt-quenching method and subsequent heat treatment. According to the XRD and TEM test results, PbS QDs and NCs were uniformly precipitated in the glass. With the heat treatment temperature increased from 460°C to 480°C, the sizes of PbS QDs and NCs increased obviously. Under the excitation of 808 nm LD, the emission at 1810 nm and the NIR tunable emission of PbS QDs appeared in the heat-treated glass simultaneously. When the emissions of PbS QDs and ions overlap after proper heat treatment, ultra-broadband emission in the NIR regions can be obtained, the emission range is 1200–2000 nm, and the FWHM reaches 430 nm, which shows great potential in the field of broadband fiber amplifiers.
References
[1] Y. Wang, N. K. Thipparapu, D. J. Richardson, J. K. Sahu. Ultra-broadband bismuth-doped fiber amplifier covering a 115-nm bandwidth in the O and E bands. J. Lightwave Technol., 39, 795(2021).
[2] A. W. Naji, B. A. Hamida, X. S. Cheng, M. A. Mahdi, S. Harun, S. Khan, W. F. Al-Khateeb, A. A. Zaidan, B. B. Zaidan, H. Ahmad. Review of erbium-doped fiber amplifier. Int. J. Phys. Sci., 6, 4674(2011).
[3] N. K. Thipparapu, Y. Wang, S. Wang, A. A. Umnikov, P. Barua, J. K. Sahu. Bi-doped fiber amplifiers and lasers. Opt. Mater. Express, 9, 2446(2019).
[4] Z. Hu, Z. Liu, Z. Zhan, T. Shi, J. Du, X. Tang, Y. Leng. Advances in metal halide perovskite lasers: synthetic strategies, morphology control, and lasing emission. Adv. Photonics, 3, 034002(2021).
[5] S. Zhang, D. Li, G. Zhao. Tunable all-fiber Er3+-doped laser based on a double-clad Er3+/Yb3+ co-doped fiber amplifier. Microw. Opt. Technol. Lett., 50, 2671(2008).
[6] L. Guo, S. Zhao, T. Li, W. Qiao, B. Ma, Y. Yang, K. Yang, H. Nie, B. Zhang, R. Wang, J. He, Y. Wang. In-band pumped, high-efficiency LGS electro-optically Q-switched 2118 nm Ho:YAP laser with low driving voltage. Opt. Laser Technol., 126, 106015(2020).
[7] Y. Zhao, D. Zhao, R. Liu, W. Ma, T. Wang. Switchable generation of a sub-200 fs dissipative soliton and a noise-like pulse in a normal-dispersion Tm-doped mode-locked fiber laser. Appl. Opt., 59, 3575(2020).
[8] Y. Xie, Z. Liu, Z. Cong, Z. Qin, S. Wang, Z. Jia, C. Li, G. Qin, X. Gao, X. Zhang. All-fiber-integrated Yb:YAG-derived silica fiber laser generating 6 W output power. Opt. Express, 27, 3791(2019).
[9] Y. Wang, J. Wu, Q. Zhao, W. Wang, J. Zhang, Z. Yang, S. Xu, M. Peng. Single-frequency DBR Nd-doped fiber laser at 1120 nm with a narrow linewidth and low threshold. Opt. Lett., 45, 2263(2020).
[10] C. Jiang. Modeling and gain properties of Er3+ and Pr3+ codoped fiber amplifier for 1.3 and 1.5 µm windows. J. Opt. Soc. Am. B, 26, 1049(2009).
[11] X. Shen, Y. Zhang, L. Xia, J. Li, G. Yang, Y. Zhou. Dual super-broadband NIR emissions in Pr3+-Er3+-Nd3+ tri-doped tellurite glass. Ceram. Int., 46, 14284(2020).
[12] J. Liu, X. Huang, H. Pan, X. Zhang, X. Fang, W. Li, H. Zhang, A. Huang, Z. Xiao. Broadband near infrared emission of Er3+/Yb3+ co-doped fluorotellurite glass. J. Alloys Compd., 866, 158568(2021).
[13] M. Zhang, W. Zheng, Y. Liu, P. Huang, Z. Gong, J. Wei, Y. Gao, S. Zhou, X. Li, X. Chen. A new class of blue-LED-excitable NIR-II luminescent nanoprobes based on lanthanide-doped CaS nanoparticles. Angew. Chem. Int. Ed., 58, 9556(2019).
[14] S. Wen, J. Zhou, K. Zheng, A. Bednarkiewicz, X. Liu, D. Jin. Advances in highly doped upconversion nanoparticles. Nat. Commun., 9, 2415(2018).
[15] L. Cormier, S. Zhou. Transition metals as optically active dopants in glass-ceramics. Appl. Phys. Lett., 116, 260503(2020).
[16] J. Ren, X. Lu, C. Lin, R. K. Jain. Luminescent ion-doped transparent glass ceramics for mid-infrared light sources. Opt. Express, 28, 21522(2020).
[17] C. Lin, L. Li, S. Dai, C. Liu, Z. Zhao, C. Bocker, C. Rüssel. Oxyfluoride glass-ceramics for transition metal ion based photonics: broadband near-IR luminescence of nickel ion dopant and nanocrystallization mechanism. J. Phys. Chem. C, 120, 4556(2016).
[18] J. Xue, X. Wang, J. H. Jeong, X. Yan. Fabrication, photoluminescence and applications of quantum dots embedded glass ceramics. Chem. Eng. J., 383, 123082(2020).
[19] F. P. Garcia de Arquer, D. V. Talapin, V. I. Klimov, Y. Arakawa, M. Bayer, E. H. Sargent. Semiconductor quantum dots: technological progress and future challenges. Science, 373, 6555(2021).
[20] X. Huang, Q. Guo, D. Yang, X. Xiao, X. Liu, Z. Xia, F. Fan, J. Qiu, G. Dong. Reversible 3D laser printing of perovskite quantum dots inside a transparent medium. Nat. Photon., 14, 82(2020).
[21] Z. Cao, F. Hu, C. Zhang, S. Zhu, M. Xiao, X. Wang. Optical studies of semiconductor perovskite nanocrystals for classical optoelectronic applications and quantum information technologies: a review. Adv. Photonics, 2, 054001(2020).
[22] G. Dong, H. Wang, G. Chen, Q. Pan, J. Qiu. Quantum dot-doped glasses and fibers: fabrication and optical properties. Front. Mater., 2, 13(2015).
[23] X. Huang, Z. Fang, S. Kang, W. Peng, G. Dong, B. Zhou, Z. Ma, S. Zhou, J. Qiu. Controllable fabrication of novel all solid-state PbS quantum dot-doped glass fibers with tunable broadband near-infrared emission. J. Mater. Chem. C, 5, 7927(2017).
[24] R. Martin-Rodriguez, R. Geitenbeek, A. Meijerink. Incorporation and luminescence of Yb3+ in CdSe nanocrystals. J. Am. Chem. Soc., 135, 13668(2013).
[25] E. O. Serqueira, N. O. Dantas. Determination of the energy transfer section between CdS semiconductor quantum dots and Nd ions. Opt. Mater., 90, 252(2019).
[26] Z. Peng, X. Huang, Z. Ma, G. Dong, J. Qiu. Surface modification and fabrication of white-light-emitting Tm3+/CdS quantum dots co-doped glass fibers. J. Am. Ceram. Soc., 102, 5818(2019).
[27] G. Kresse, D. Joubert. From ultrasoft pseudopotentials to the projector augmented-wave method. Phys. Rev. B, 59, 1758(1999).
[28] G. Kresse, J. Furthmuller. Efficiency of ab-initio total energy calculations for metals and semiconductors using a plane-wave basis set. Comput. Mater. Sci., 6, 15(1996).
[29] X. Huang, Z. Peng, Q. Guo, X. Song, J. Qiu, G. Dong. Energy transfer process and temperature-dependent photoluminescence of PbS quantum dot-doped glasses. J. Am. Ceram. Soc., 102, 3391(2019).
[30] S. A. Wade, S. F. Collins, G. W. Baxter. Fluorescence intensity ratio technique for optical fiber point temperature sensing. J. Appl. Phys., 94, 4743(2003).

Set citation alerts for the article
Please enter your email address
© Copyright 2018-2021 | Chinese Laser Press. All Rights Reserved 沪ICP备15018463号-20