• Chinese Optics Letters
  • Vol. 13, Issue 8, 081901 (2015)
Xiong Shen1, Jun Liu1、2、*, Fangjia Li1、3, Peng Wang1, and Ruxin Li1、2
Author Affiliations
  • 1State Key Laboratory of High Field Laser Physics, Shanghai Institute of Optics and Fine Mechanics, Chinese Academy of Sciences, Shanghai 201800, China
  • 2IFSA Collaborative Innovation Center, Shanghai Jiao Tong University, Shanghai 200240, China
  • 3Tongji University, Shanghai 200092, China
  • show less
    DOI: 10.3788/COL201513.081901 Cite this Article Set citation alerts
    Xiong Shen, Jun Liu, Fangjia Li, Peng Wang, Ruxin Li. Extended transient-grating self-referenced spectral interferometry for sub-100  nJ femtosecond pulse characterization[J]. Chinese Optics Letters, 2015, 13(8): 081901 Copy Citation Text show less
    (a) The optical setup of the RMO based TG-SRSI. P1, aluminum-coated, fused silica plate; P2, nonlinear material; A, black plate; L, lens; M, reflective plane mirror; S, spectrometer; a and b are cross sections of the portions indicated by the arrows and c is the black plate. All are seen from the right side. (b) BOXCARS phase-matching geometry.
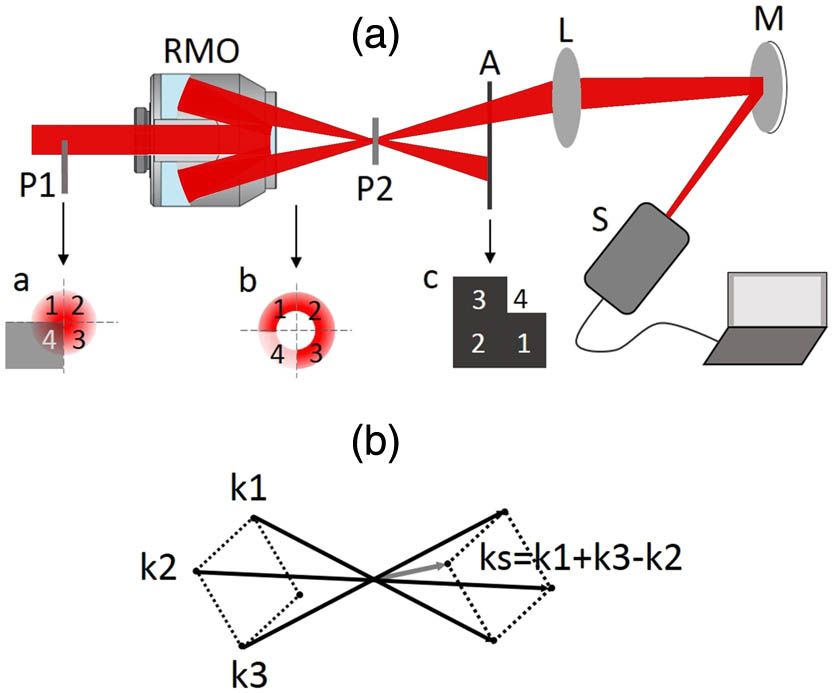
    Fig. 1. (a) The optical setup of the RMO based TG-SRSI. P1, aluminum-coated, fused silica plate; P2, nonlinear material; A, black plate; L, lens; M, reflective plane mirror; S, spectrometer; a and b are cross sections of the portions indicated by the arrows and c is the black plate. All are seen from the right side. (b) BOXCARS phase-matching geometry.
    (a) Spectral intensity of the test beam (red curve), the TG signal (blue curve), and the interference between them (black curve) measured directly with the spectrometer. (b) The spectrum retrieved (black solid curve) and the spectral phase (black dotted curve) by using TG-SRSI. The spectrum retrieved (blue solid curve) and the spectral phase retrieved (blue dotted curve) by using SHG-FROG. The red curve is the spectrum of the test beam measured directly by the spectrometer. (c) The temporal profiles (solid curves) and phases (dashed curves) retrieved by using TG-SRSI (black curves) and SHG-FROG (blue curves). (d) Spectra of three TG signals measured directly by the spectrometer. Spectra from the bottom to the top correspond to when the input pulse energies are 65, 75, and 85 nJ, respectively.
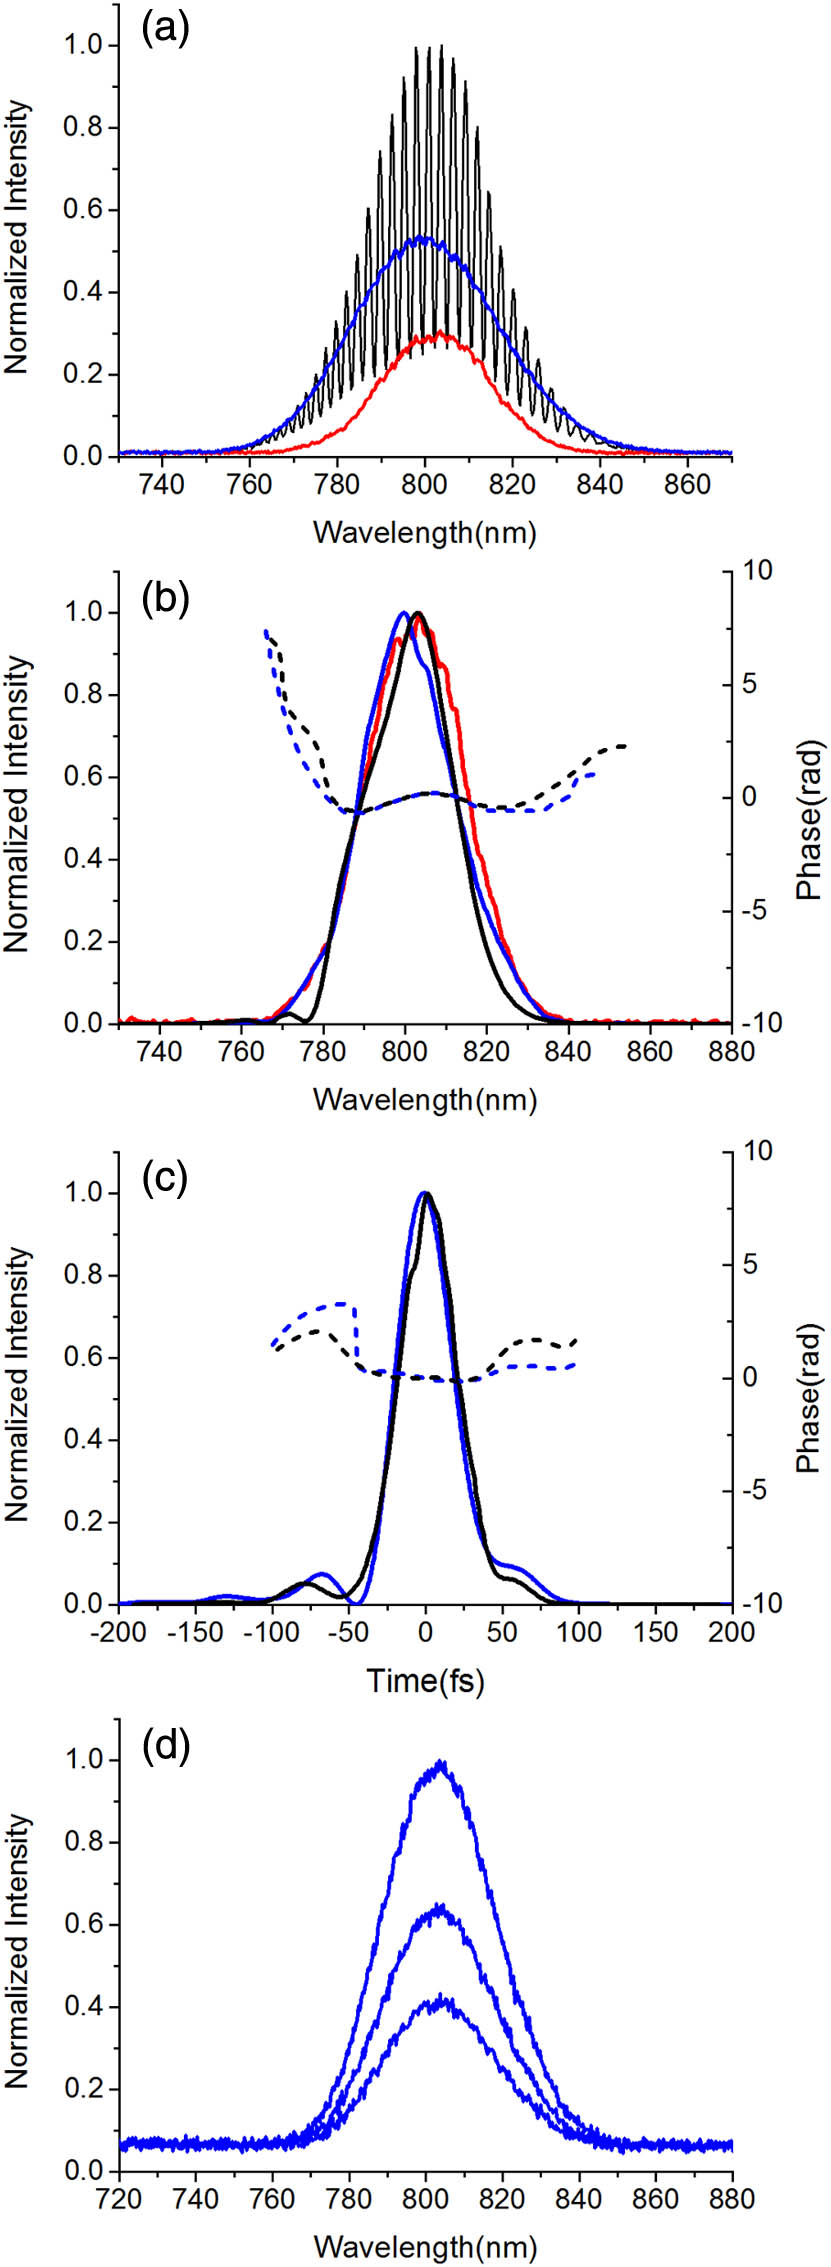
    Fig. 2. (a) Spectral intensity of the test beam (red curve), the TG signal (blue curve), and the interference between them (black curve) measured directly with the spectrometer. (b) The spectrum retrieved (black solid curve) and the spectral phase (black dotted curve) by using TG-SRSI. The spectrum retrieved (blue solid curve) and the spectral phase retrieved (blue dotted curve) by using SHG-FROG. The red curve is the spectrum of the test beam measured directly by the spectrometer. (c) The temporal profiles (solid curves) and phases (dashed curves) retrieved by using TG-SRSI (black curves) and SHG-FROG (blue curves). (d) Spectra of three TG signals measured directly by the spectrometer. Spectra from the bottom to the top correspond to when the input pulse energies are 65, 75, and 85 nJ, respectively.
    Xiong Shen, Jun Liu, Fangjia Li, Peng Wang, Ruxin Li. Extended transient-grating self-referenced spectral interferometry for sub-100  nJ femtosecond pulse characterization[J]. Chinese Optics Letters, 2015, 13(8): 081901
    Download Citation