
Xin Zhang, Shaoyan Gai, Feipeng Da. Fast Three-Dimensional Measurement Based on Three Channel Binary Fringe Defocused Projection[J]. Laser & Optoelectronics Progress, 2020, 57(23): 231201
- Laser & Optoelectronics Progress
- Vol. 57, Issue 23, 231201 (2020)
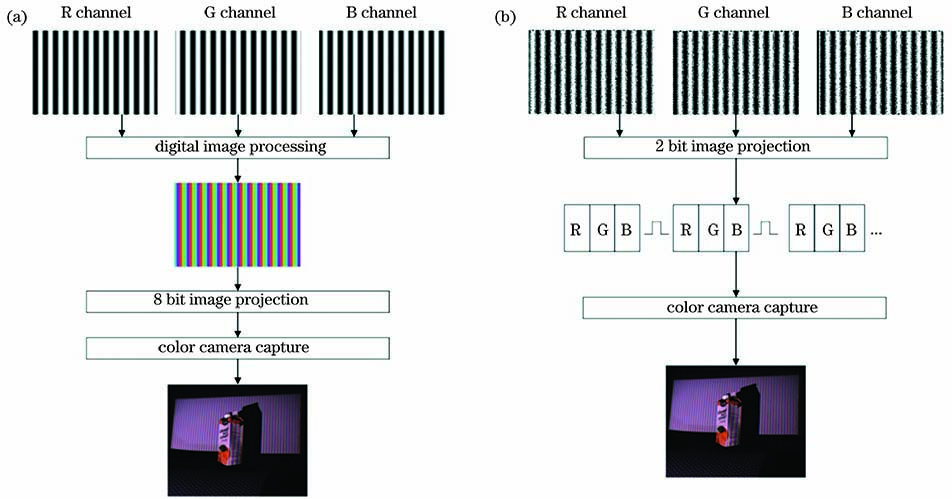
Fig. 1. Flow chart of color fringe projection. (a) Traditional color fringe projection; (b) color defocusing binary projection
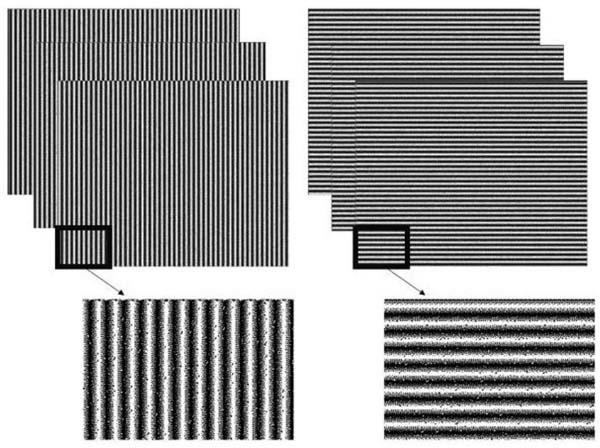
Fig. 2. Binary fringe image obtained by dither modulation
Fig. 3. Complete flow of a single measurement frame
Fig. 4. Installation diagram of the experimental system
Fig. 5. Spectral response graph of the camera sensor
Fig. 6. Decomposed image of three channels. (a) Color stripe image on white plate; (b)--(d) stripe image of RGB channel on white plate; (e) color stripe image on doll; (f)--(h) RGB channel stripe image of doll
Fig. 7. Sine of fringes obtained by different methods. (a) 8 bit projection; (b) 8 bit projection with black-and-white camera auxiliary decoupling; (c) 2 bit projection; (d) 2 bit projection with black-and-white camera auxiliary decoupling
Fig. 8. Measurement results of our method
Fig. 9. Height and standard value of the 34th row of the 3D data. (a) 8 bit projection; (b) 8 bit projection with black-and-white camera auxiliary decoupling; (c) 2 bit projection; (d) 2 bit projection with black-and-white camera auxiliarydecoupling
Fig. 10. Topography reconstruction of colored objects. (a) Wrapped phase; (b) global phase; (c) reconstruction result
Fig. 11. Dynamic object reconstruction result of our method
|
Table 1. Number of reconstructed frames per second for different methods unit: frame
|
Table 2. Mean and standard deviation of reconstruction error unit: mm

Set citation alerts for the article
Please enter your email address
© Copyright 2018-2021 | Chinese Laser Press. All Rights Reserved 沪ICP备15018463号-20