• Acta Optica Sinica
  • Vol. 41, Issue 1, 0130003 (2021)
Wenqing Liu1、*, Xingping Wang1、2, Guosheng Ma1、3, Ying Liu1、3, Zhihao Zhao4, Xiang Li1, Hao Deng1, Bing Chen1、**, and Ruifeng Kan1
Author Affiliations
  • 1Key Laboratory of Environmental Optics and Technology, Anhui Institute of Optics and Fine Mechanics, Hefei Institute of Physical Science, Chinese Academy of Sciences, Hefei, Anhui 230031, China
  • 2School of Engineering Science, University of Science and Technology of China, Hefei, Anhui 230027, China
  • 3School of Science Island, University of Science and Technology of China, Hefei, Anhui 230031, China
  • 4College of Information Science and Engineering, Northeastern University, Shenyang, Liaoning 110000, China
  • show less
    DOI: 10.3788/AOS202141.0130003 Cite this Article Set citation alerts
    Wenqing Liu, Xingping Wang, Guosheng Ma, Ying Liu, Zhihao Zhao, Xiang Li, Hao Deng, Bing Chen, Ruifeng Kan. Research of High Sensitivity Cavity Ring-Down Spectroscopy Technology and Its Application[J]. Acta Optica Sinica, 2021, 41(1): 0130003 Copy Citation Text show less
    Schematic of atmospheric CO2 concentration measurement based on CRDS
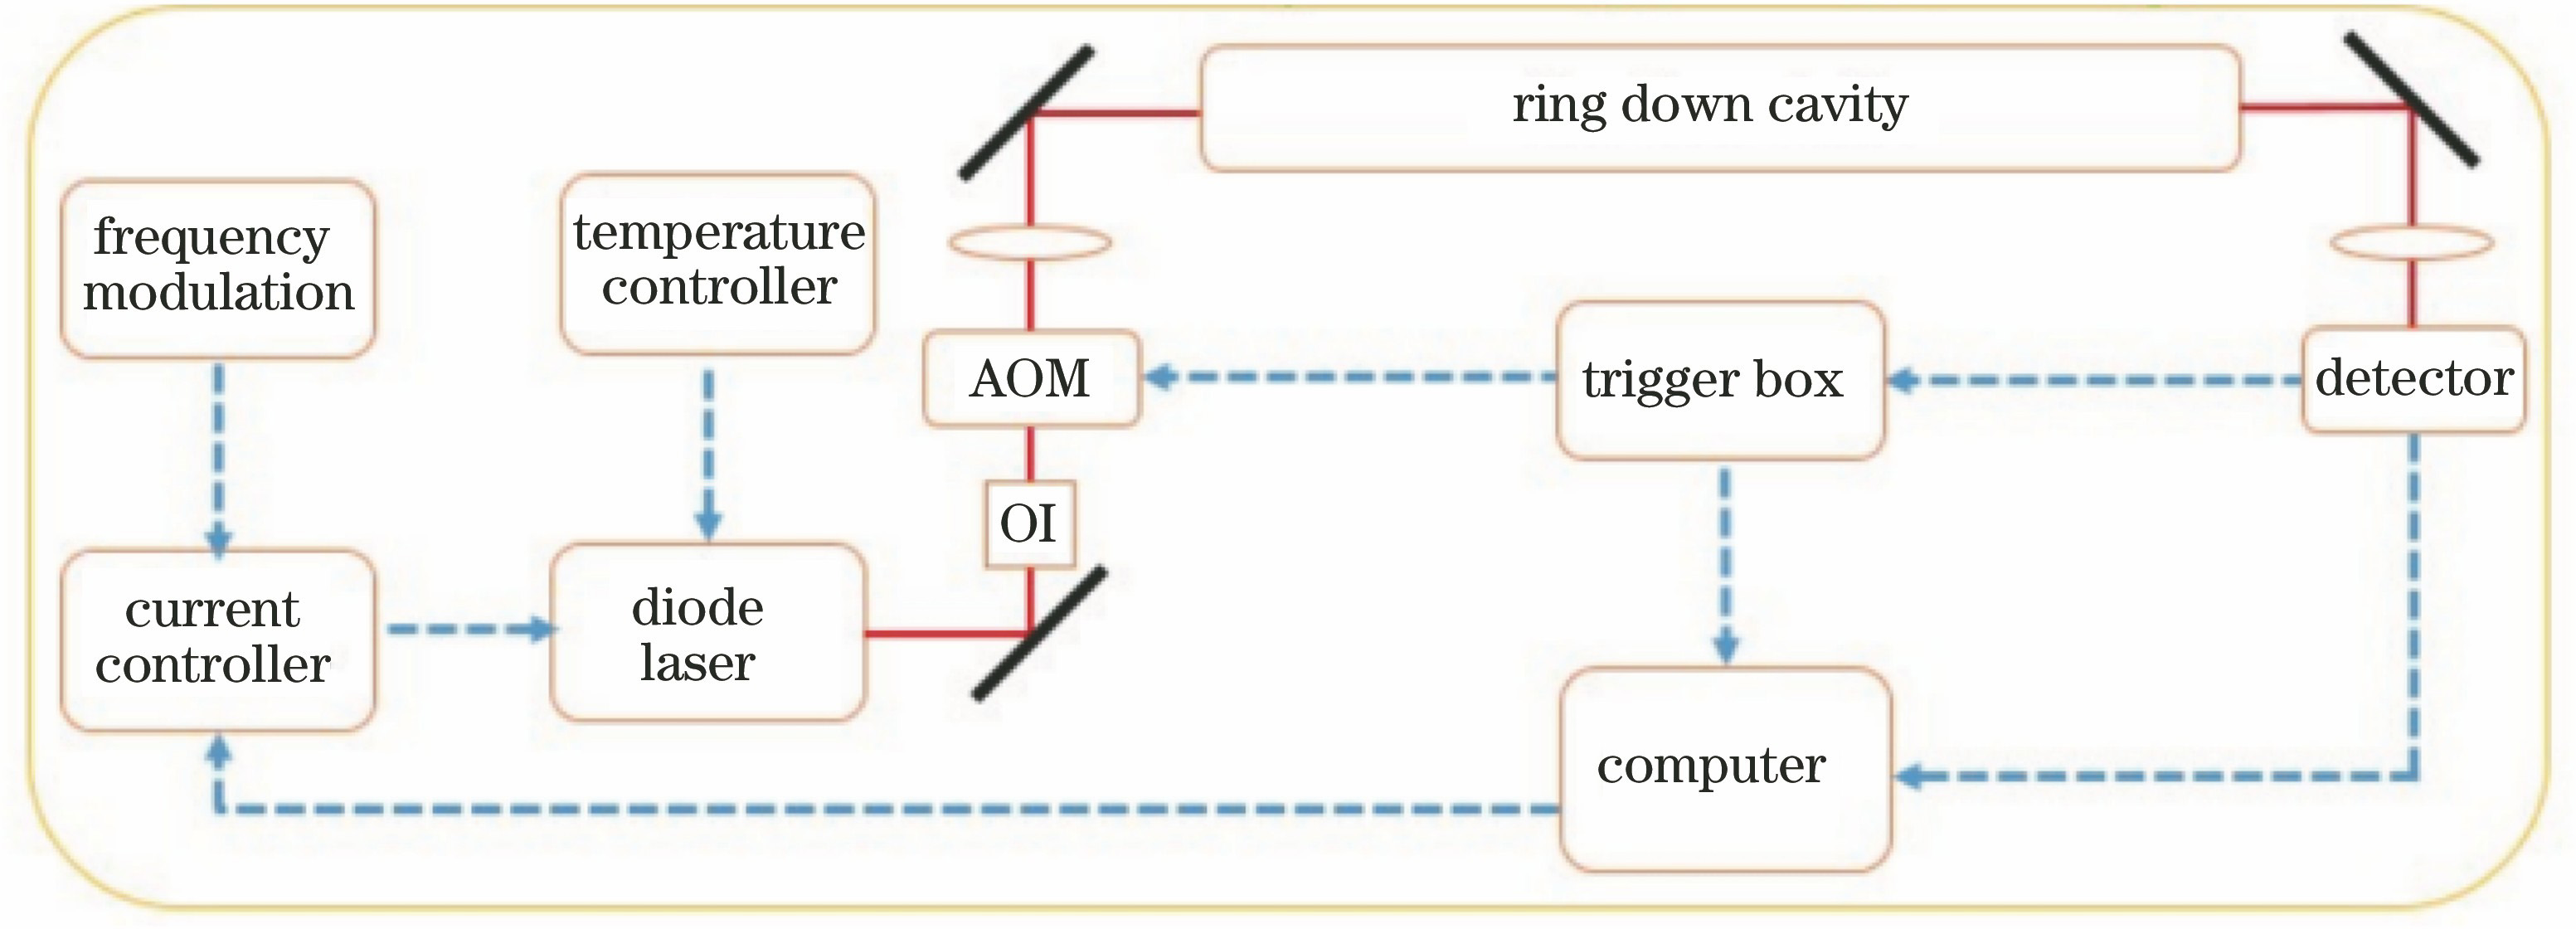
    Fig. 1. Schematic of atmospheric CO2 concentration measurement based on CRDS
    Results of long-time measurement of empty cavity. (a) Ring down measurement result; (b) result of Allen variance
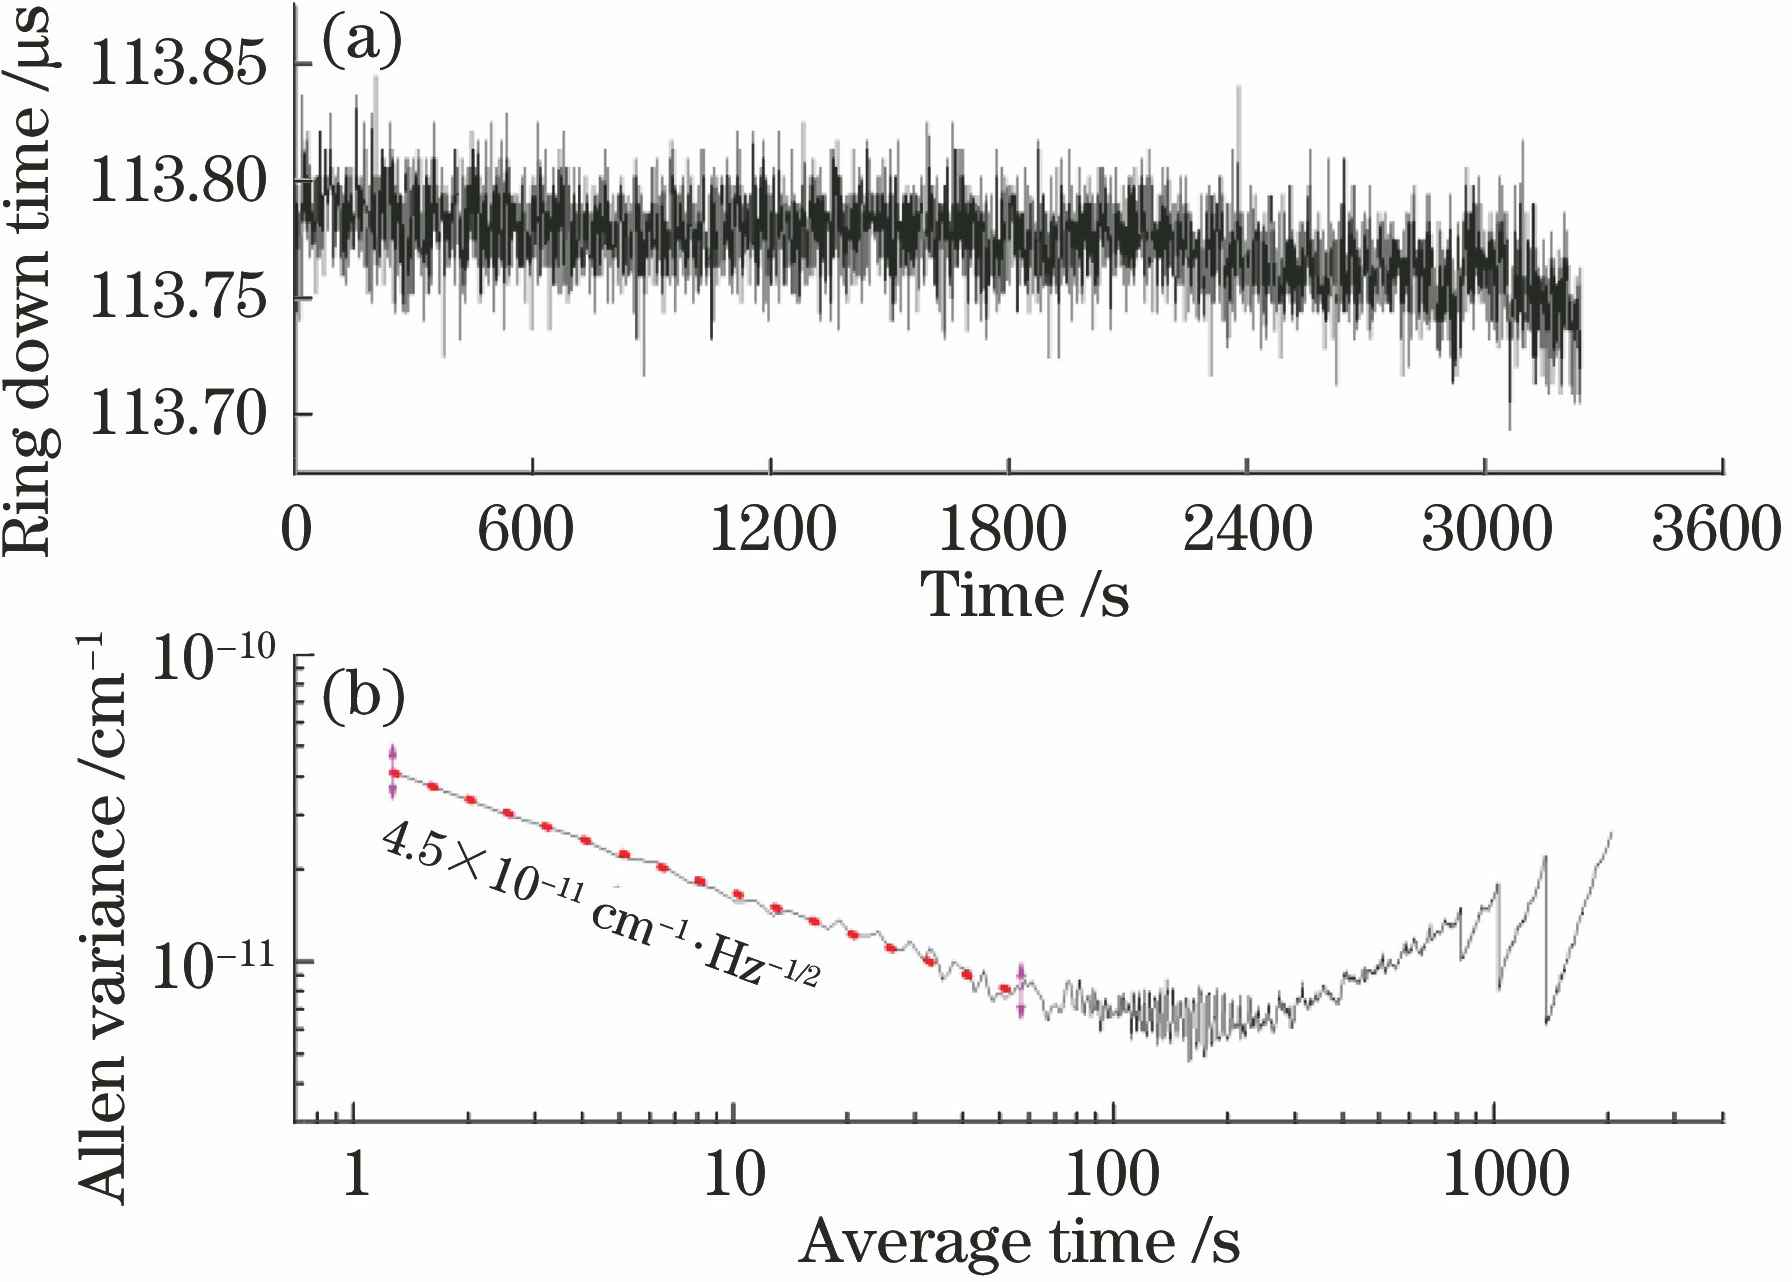
    Fig. 2. Results of long-time measurement of empty cavity. (a) Ring down measurement result; (b) result of Allen variance
    Spectral fitting of CO2 with concentration of 99×10-6 and its residual
    Fig. 3. Spectral fitting of CO2 with concentration of 99×10-6 and its residual
    Schematic of high vacuum optical hygrometer based on CRDS[93]
    Fig. 4. Schematic of high vacuum optical hygrometer based on CRDS[93]
    Integral absorption coefficients of the four absorption lines selected at dew-point temperature with different vapor pressures[93]
    Fig. 5. Integral absorption coefficients of the four absorption lines selected at dew-point temperature with different vapor pressures[93]
    Measurement results of trace water vapor absorption spectrum[93]
    Fig. 6. Measurement results of trace water vapor absorption spectrum[93]
    Schematic of atmospheric methane measuring instrument based on CRDS[96]
    Fig. 7. Schematic of atmospheric methane measuring instrument based on CRDS[96]
    Results of continuous monitoring of atmospheric methane concentration[96]
    Fig. 8. Results of continuous monitoring of atmospheric methane concentration[96]
    Methane vertical profile measurement system based on balloon-borne CRDS[89]. (a) System principle diagram; (b) physical diagram of the system
    Fig. 9. Methane vertical profile measurement system based on balloon-borne CRDS[89]. (a) System principle diagram; (b) physical diagram of the system
    The site of the second Qinghai-Tibet Plateau comprehensive scientific research test by captive balloon at Lulang[89]
    Fig. 10. The site of the second Qinghai-Tibet Plateau comprehensive scientific research test by captive balloon at Lulang[89]
    Spectral measurement and fitting results[89]. (a) At 5250 m altitude during the ascent; (b) at 5600 m altitude during the descent
    Fig. 11. Spectral measurement and fitting results[89]. (a) At 5250 m altitude during the ascent; (b) at 5600 m altitude during the descent
    Measurement results of vertical distribution of methane concentration[89]. (a) During the ascent; (b) during the descent
    Fig. 12. Measurement results of vertical distribution of methane concentration[89]. (a) During the ascent; (b) during the descent
    Schematic of in situ analysis system for deep-sea dissolved methane[88]
    Fig. 13. Schematic of in situ analysis system for deep-sea dissolved methane[88]
    3D design drawing of optical cavity[88]
    Fig. 14. 3D design drawing of optical cavity[88]
    In the case of water vapor interference, the results of methane spectral fitting and its residual[88]. (a) Without water vapor spectral fitting; (b) with water vapor spectral fitting
    Fig. 15. In the case of water vapor interference, the results of methane spectral fitting and its residual[88]. (a) Without water vapor spectral fitting; (b) with water vapor spectral fitting
    Compared with the measurement results of atmospheric methane concentration by the AIOFM methanometer and the commercial Piccaro methanometer[88]
    Fig. 16. Compared with the measurement results of atmospheric methane concentration by the AIOFM methanometer and the commercial Piccaro methanometer[88]
    Wenqing Liu, Xingping Wang, Guosheng Ma, Ying Liu, Zhihao Zhao, Xiang Li, Hao Deng, Bing Chen, Ruifeng Kan. Research of High Sensitivity Cavity Ring-Down Spectroscopy Technology and Its Application[J]. Acta Optica Sinica, 2021, 41(1): 0130003
    Download Citation