
Ping Zhang, Yongze Ding, Zhipeng Wang, Beichen Li, Zhiren Tian. Accurate Reading and Reliability Estimation Model of Substation Pointer Meter[J]. Laser & Optoelectronics Progress, 2020, 57(10): 101012
- Laser & Optoelectronics Progress
- Vol. 57, Issue 10, 101012 (2020)
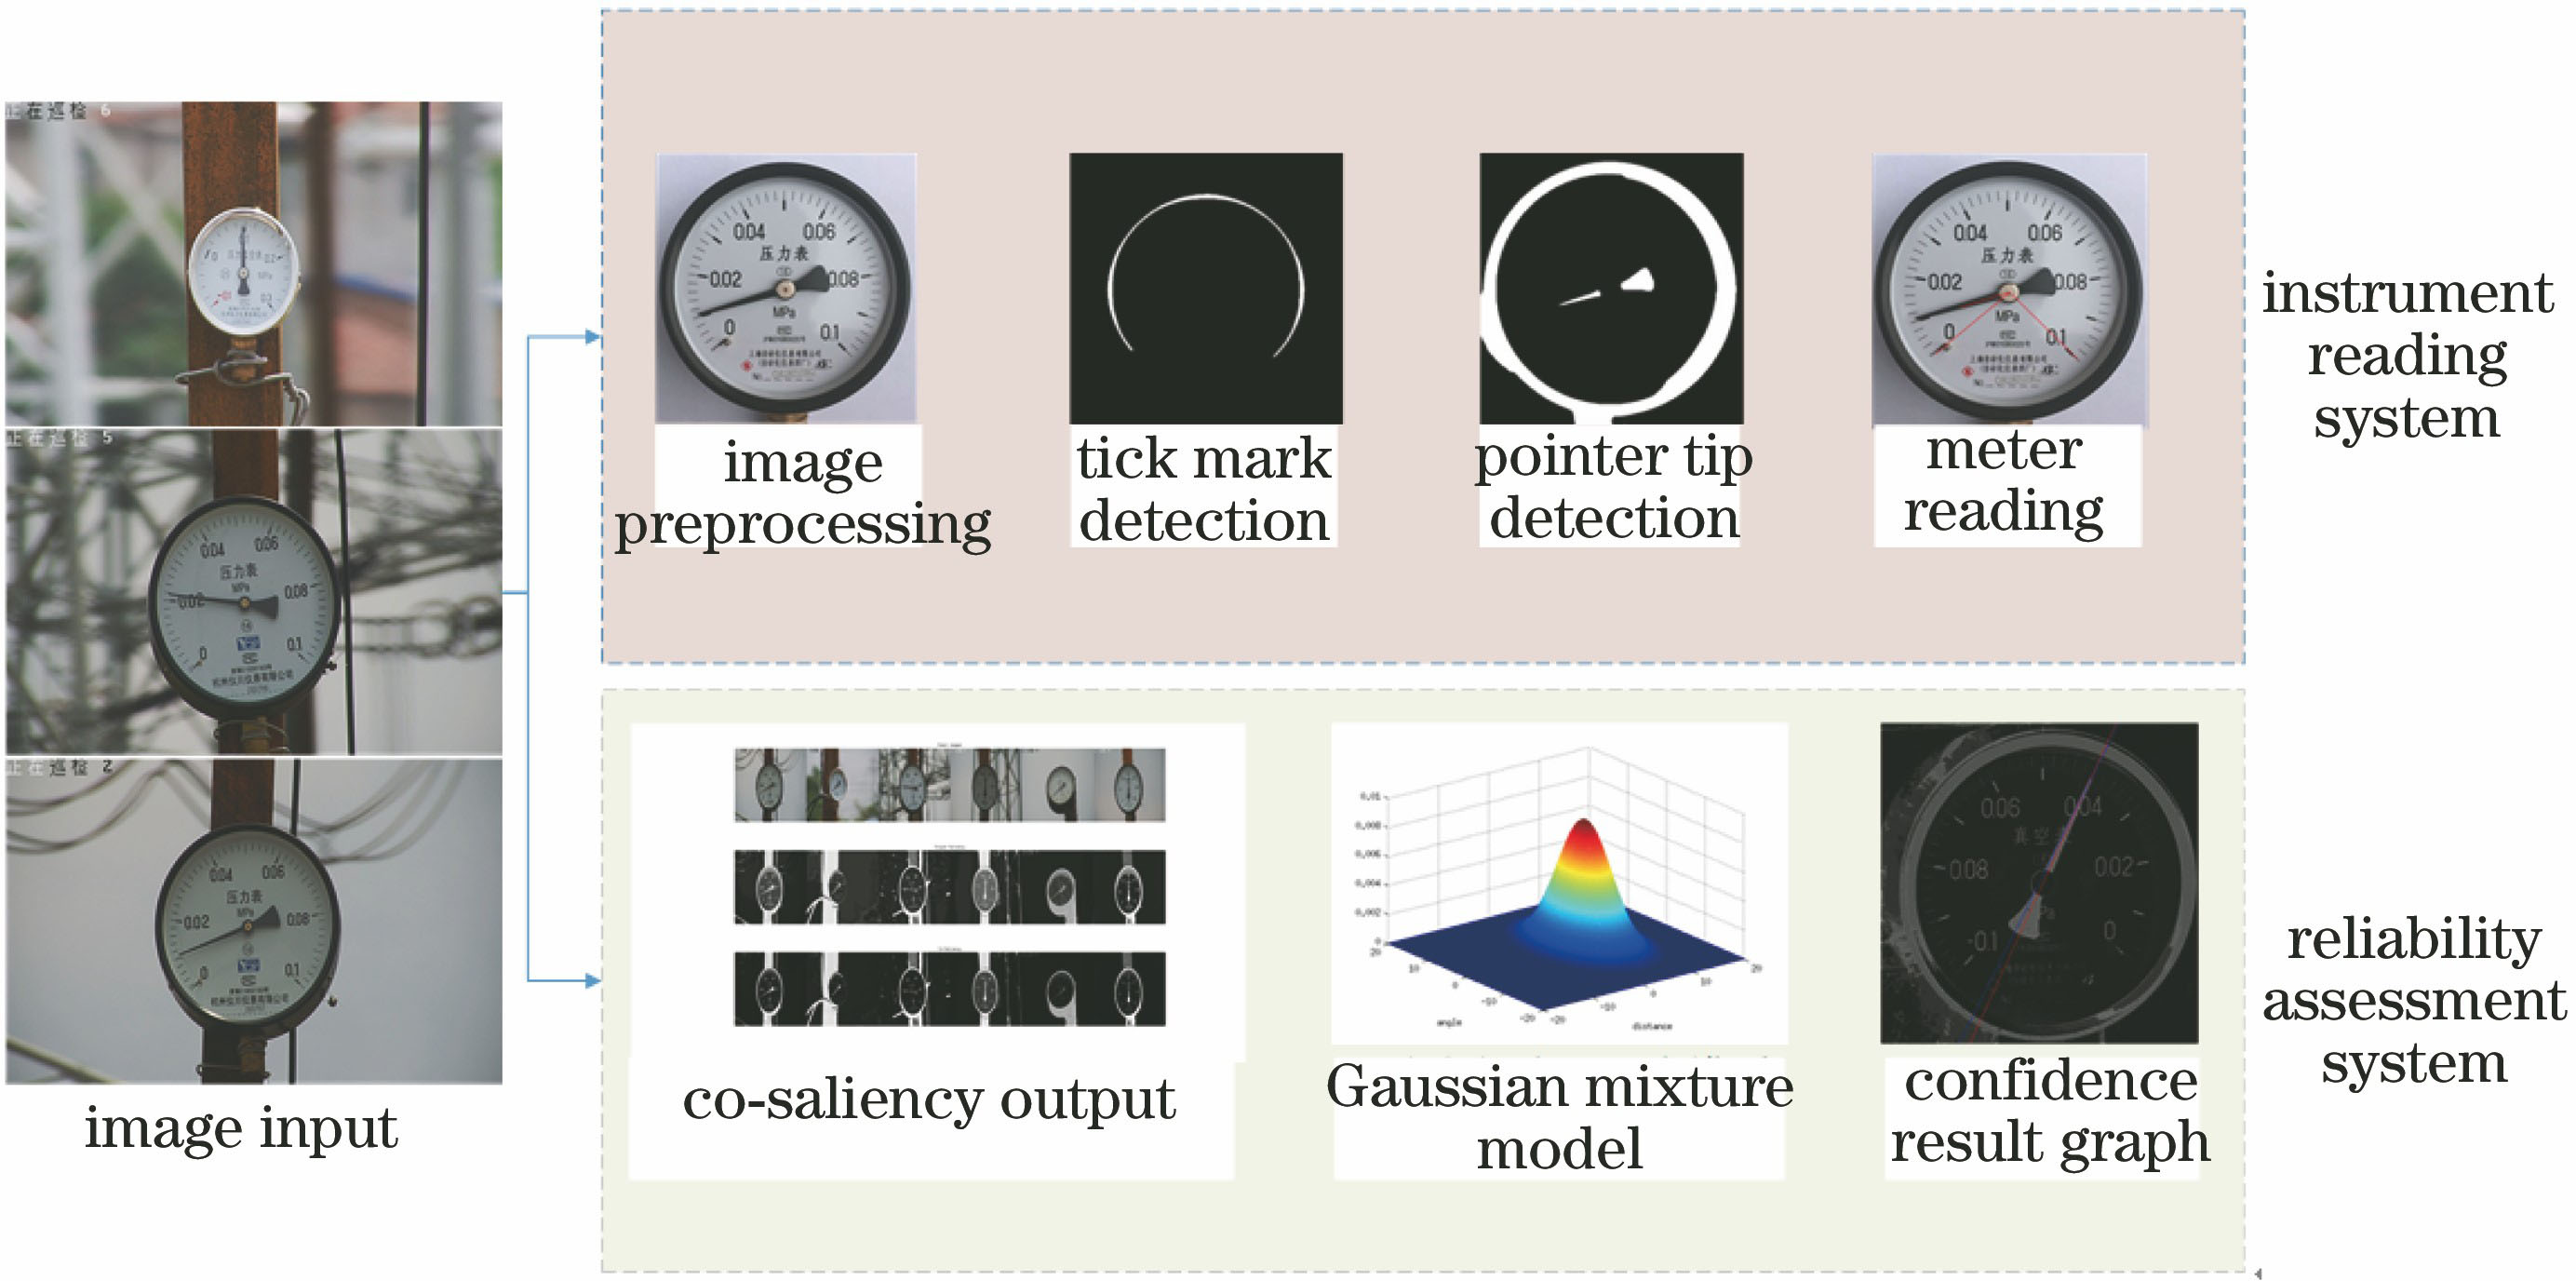
Fig. 1. Overall flow chart of proposed method

Fig. 2. Detection of pointer tip positioning
Fig. 3. Schematic of the meter reading
Fig. 4. Overall flow chart of instrument reading algorithm
Fig. 5. Flow chart of consistently significant algorithm
Fig. 6. Two-parameter Gaussian model. (a) Gaussian model curves of distance; (b) Gaussian model curves of angle
Fig. 7. Two-parameter three-dimensional Gaussian model. (a) Schematic of three-dimensional Gaussian model; (b) top view of three-dimensional Gaussian model
Fig. 8. Results of initial tick mark, end tick mark, and hand extraction. (a) Original input images; (b)tick rings; (c) meter rings; (d) experimental results by proposed method
Fig. 9. Comparison of pointer location results. (a) Traditional Hough method; (b) proposed method
Fig. 10. Comparison of consistently significant detection effects. (a) Original input image; (b) consistent saliency detection; (c) single image saliency detection
Fig. 11. Comparison of consistently significant image reading results. (a) Significant image reading results; (b) partial enlargements; (c) deviation from the rectangular frame by two algorithms
|
Table 1. Error rate of initial tick reading results
| ||||||||||||||||||||||||||||||||||||||||||||||||
Table 2. Test results of reliability estimation model

Set citation alerts for the article
Please enter your email address
© Copyright 2018-2021 | Chinese Laser Press. All Rights Reserved 沪ICP备15018463号-20