• Journal of Inorganic Materials
  • Vol. 36, Issue 11, 1223 (2021)
Pengpeng LI, Bing WANG*, and Yingde WANG*
Author Affiliations
  • Science and Technology on Advanced Ceramic Fibers and Composites Laboratory, College of Aerospace Science and Engineering, National University of Defense Technology, Changsha 410073, China
  • show less
    DOI: 10.15541/jim20210142 Cite this Article
    Pengpeng LI, Bing WANG, Yingde WANG. Ultrafast CO Sensor Based on Flame-annealed Porous CeO2 Nanosheets for Environmental Application [J]. Journal of Inorganic Materials, 2021, 36(11): 1223 Copy Citation Text show less
    Schematic illustration of preparation of CeO2 nanosheets
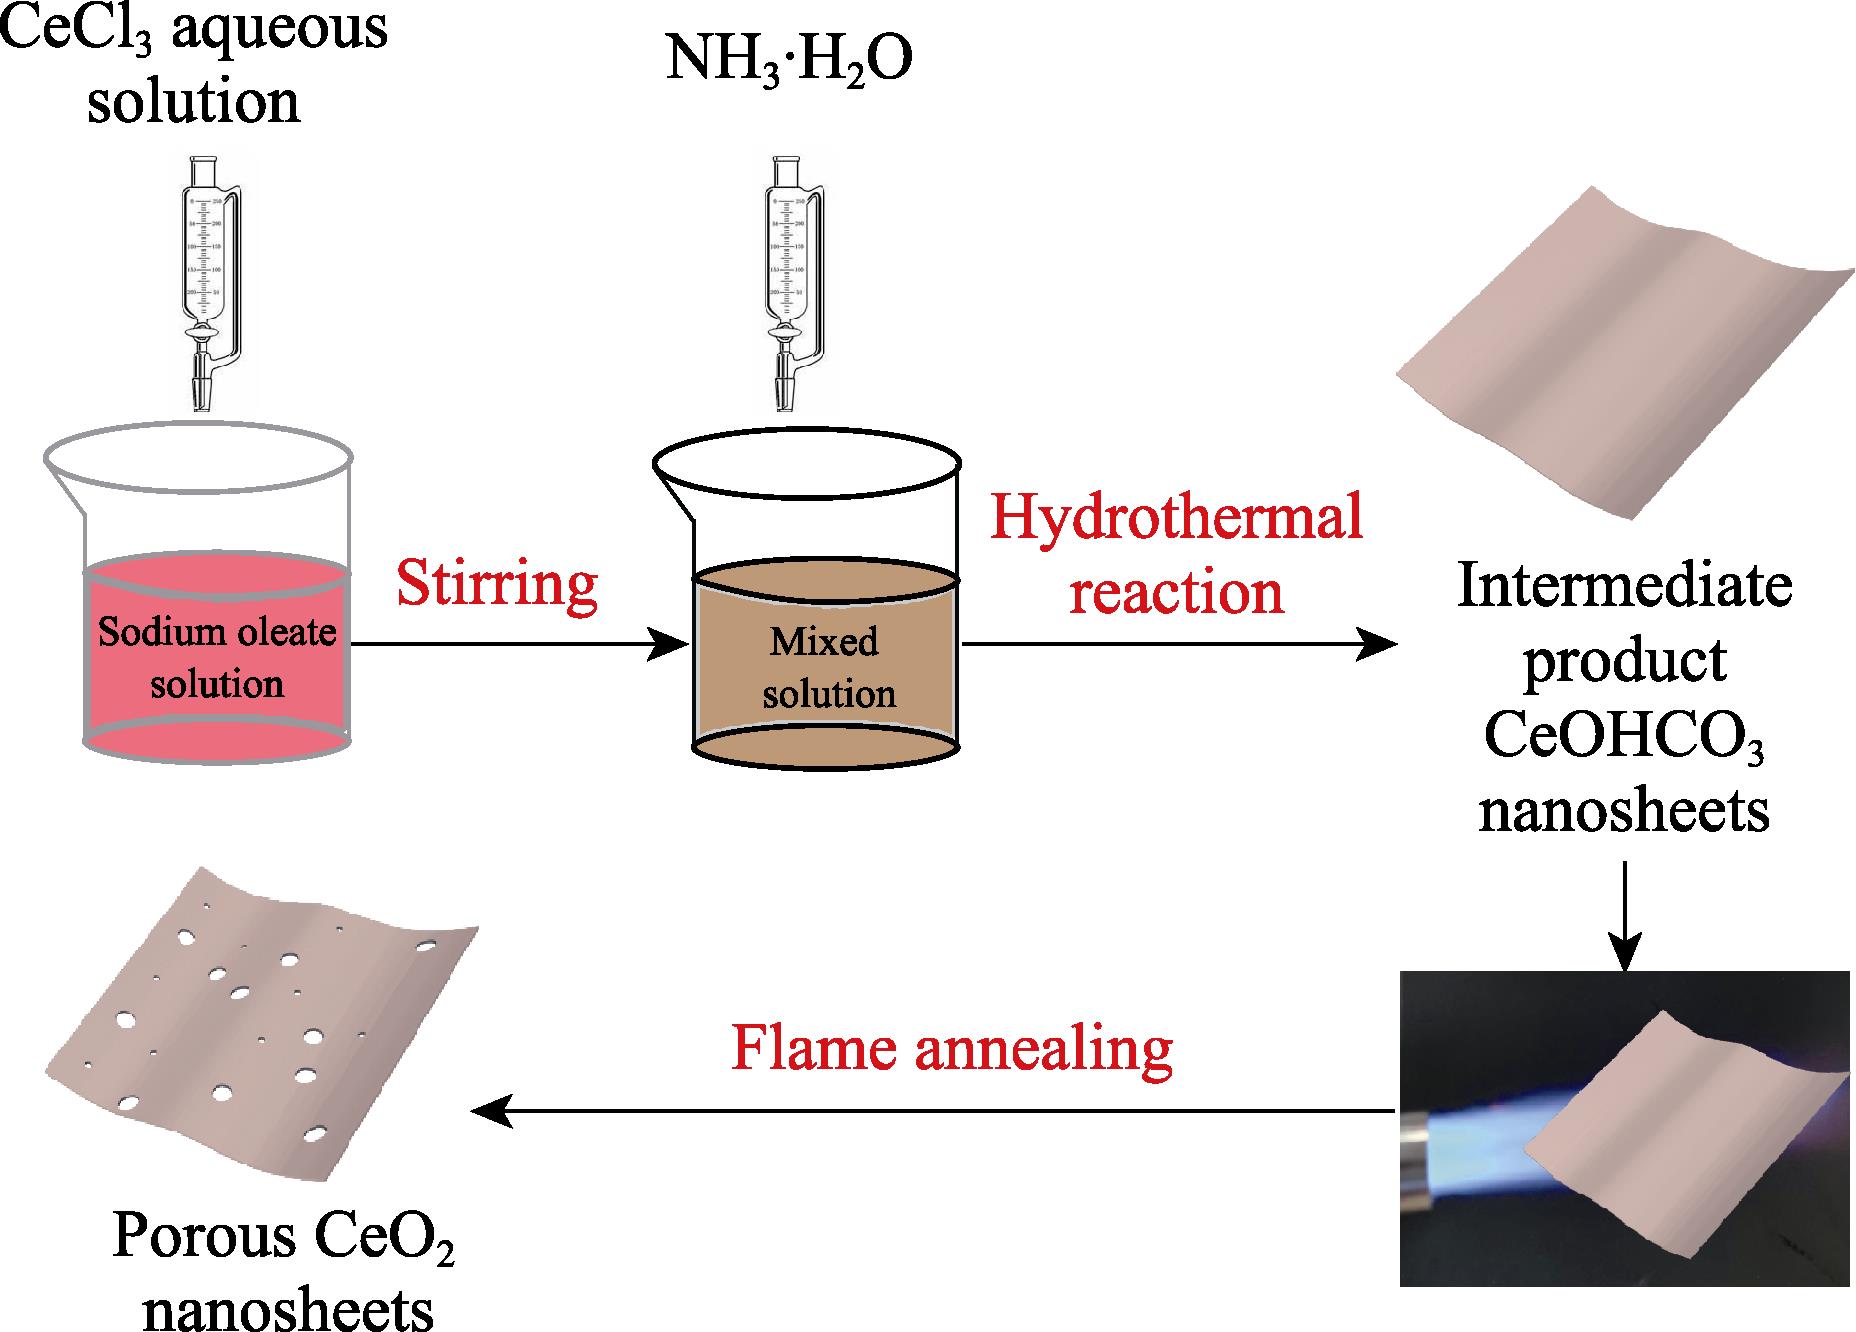
    1. Schematic illustration of preparation of CeO2 nanosheets
    XRD patterns of the flame-annealed CeO2 nanosheets
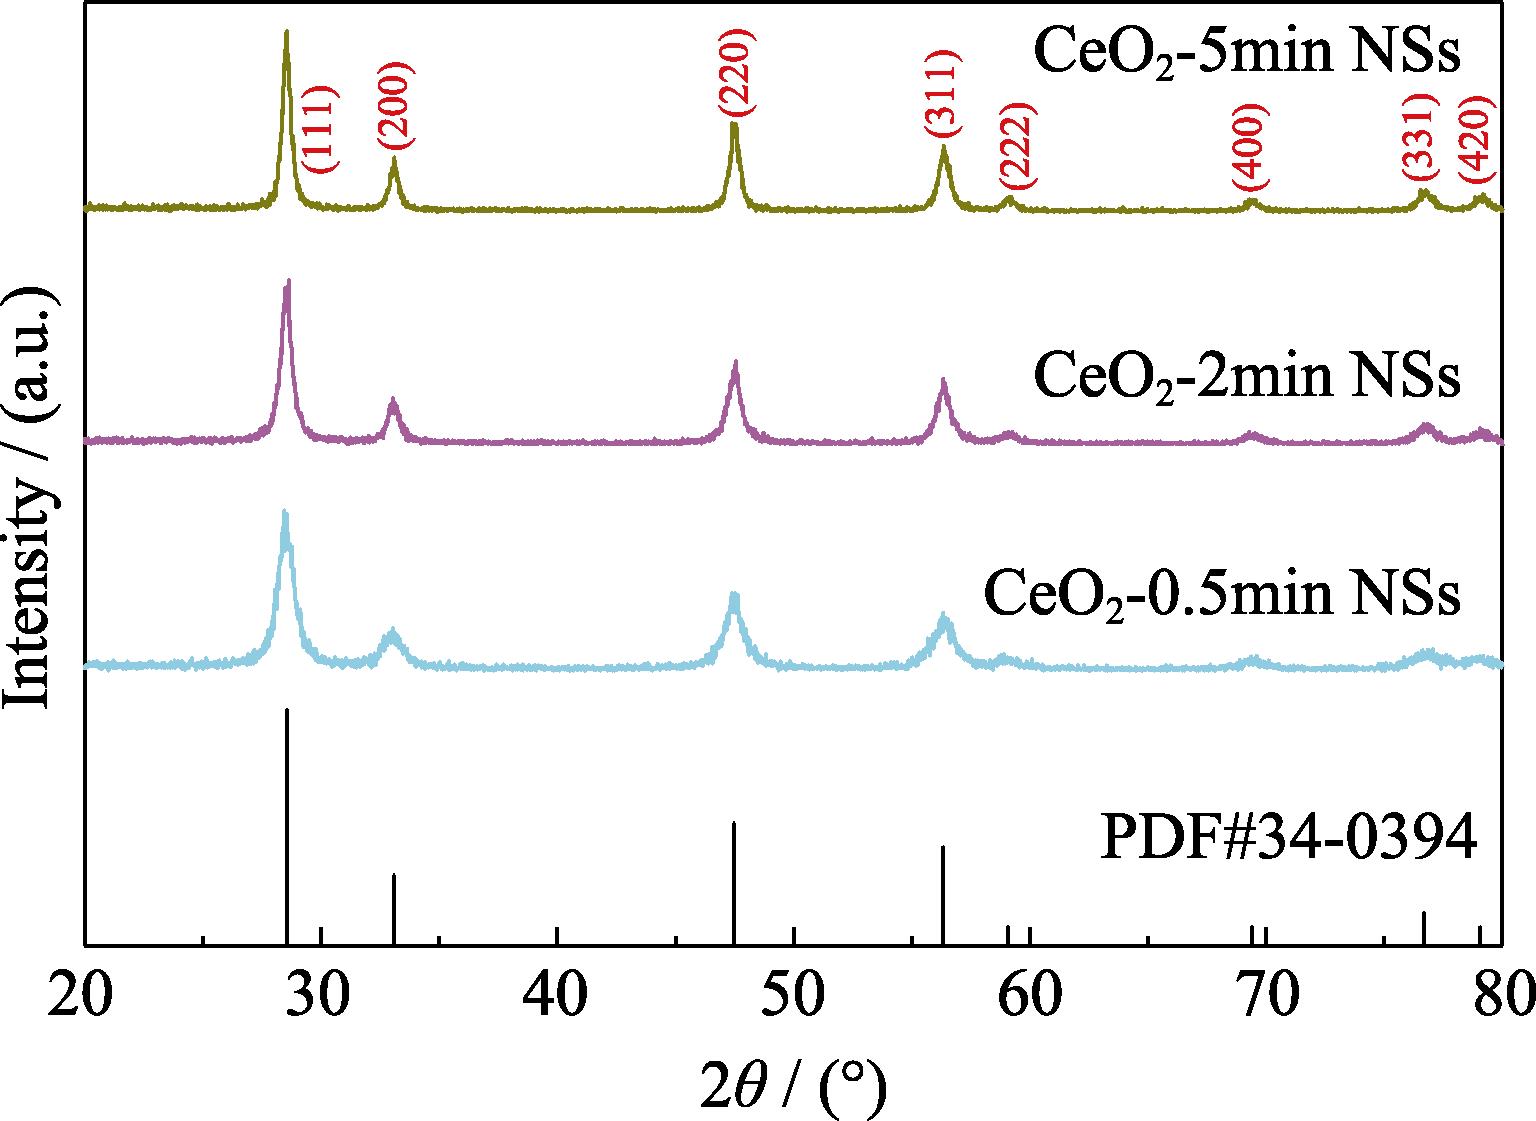
    2. XRD patterns of the flame-annealed CeO2 nanosheets
    XPS spectra of the CeO2 NSs (a, b, c) high resolution spectra of O 1s of CeO2-0.5min NSs, CeO2-2min NSs and CeO2-5min NSs; (d, e, f) high resolution spectra of Ce 3d of CeO2-0.5min NSs, CeO2-2min NSs and CeO2-5min NSs
    3. XPS spectra of the CeO2 NSs (a, b, c) high resolution spectra of O 1s of CeO2-0.5min NSs, CeO2-2min NSs and CeO2-5min NSs; (d, e, f) high resolution spectra of Ce 3d of CeO2-0.5min NSs, CeO2-2min NSs and CeO2-5min NSs
    Morphologies and structure characterizations of the as-prepared samples(a, b, c) TEM images of CeO2-0.5min NSs, CeO2-2min NSs and CeO2-5min NSs (pores are labelled by red dotted circles); (d, e, f) HRTEM images of CeO2-0.5min NSs, CeO2-2min NSs and CeO2-5min NSs
    4. Morphologies and structure characterizations of the as-prepared samples(a, b, c) TEM images of CeO2-0.5min NSs, CeO2-2min NSs and CeO2-5min NSs (pores are labelled by red dotted circles); (d, e, f) HRTEM images of CeO2-0.5min NSs, CeO2-2min NSs and CeO2-5min NSs
    (a) Nitrogen adsorption-desorption isotherms and (b) pore size distributions of CeO2 NSs
    5. (a) Nitrogen adsorption-desorption isotherms and (b) pore size distributions of CeO2 NSs
    EPR spectra of CeO2 NSs
    6. EPR spectra of CeO2 NSs
    Gas sensing properties of CeO2 NSs (a) Response of CeO2 NSs at different temperatures from 300 ℃ to 500 ℃ with an interval of 50 ℃ towards 500 μL/L CO; (b) Response of CeO2-2min NSs towards 500 μL/L CO at 450 ℃ for seven periods; (c) Transient response of CeO2-2min NSs towards different concentration from 10 μL/L to 10000 μL/L at 450 ℃; (d) Fitting of CO concentration and its corresponding response; (e) Determination of response/recovery time of CeO2-2min NSs towards 500 μL/L CO at 450 ℃; (f) Selectivity of CeO2-2min NSs towards CH4, H2, NH3, NO2 and CO at 450 ℃
    7. Gas sensing properties of CeO2 NSs (a) Response of CeO2 NSs at different temperatures from 300 ℃ to 500 ℃ with an interval of 50 ℃ towards 500 μL/L CO; (b) Response of CeO2-2min NSs towards 500 μL/L CO at 450 ℃ for seven periods; (c) Transient response of CeO2-2min NSs towards different concentration from 10 μL/L to 10000 μL/L at 450 ℃; (d) Fitting of CO concentration and its corresponding response; (e) Determination of response/recovery time of CeO2-2min NSs towards 500 μL/L CO at 450 ℃; (f) Selectivity of CeO2-2min NSs towards CH4, H2, NH3, NO2 and CO at 450 ℃
    Schematic illustration of CO gas sensing mechanism Yellow spheres represent O atoms; Orange spheres represent Ce atoms; Red rings represent the position of oxygen vacancies
    8. Schematic illustration of CO gas sensing mechanism Yellow spheres represent O atoms; Orange spheres represent Ce atoms; Red rings represent the position of oxygen vacancies
    XRD pattern of the intermediate product
    S1. XRD pattern of the intermediate product
    Response of CeO2-2min NSs towards 500 μL/L CO at 450 ℃ under different humidities
    S2. Response of CeO2-2min NSs towards 500 μL/L CO at 450 ℃ under different humidities
    Long-term stability of CeO2-2min NSs towards 500 μL/L CO at 450 ℃ for two weeks
    S3. Long-term stability of CeO2-2min NSs towards 500 μL/L CO at 450 ℃ for two weeks
    OS/% OV/% Ce3+/% Ce3+/Ce4+
    CeO2-0.5min NSs 19.040.026.30.357
    CeO2-2min NSs 14.843.228.60.401
    CeO2-5min NSs 15.142.723.80.312
    Table 1.

    Percentage of each element species to the whole element content

    MaterialConcentration/(μL∙L-1) Temperature/℃Sensitivity(Response/recovery time)/sRef.
    Co3O4 nanostructures 51002.4a14/36[23]
    Pd/SnO21001003.5a60/150[24]
    TiO2-CeO2 mixed oxides 40020010.7a32/45[25]
    SnO2/MoO2100RT9.2%b20/16[1]
    SnO2-CeO2 mixed oxides 500430190%b26/30[11]
    Pd/SnO2 nanowires 2004006.8a5/40[26]
    ZnO nanorods304001.1a46/27[27]
    Porous CeO2 nanosheets 50045012.0%b2/2This work
    Table 1.

    Recent materials for in CO gas sensing

    Surface area/(m2∙g-1) Pore volume/ (cm3∙g-1) Average pore diameter/nm
    CeO2-0.5min NSs 73.3440.17210.1
    CeO2-2min NSs 46.8040.18115.5
    CeO2-5min NSs 40.8360.16315.8
    Table 2.

    Summary of surface area and pore volume of CeO2 NSs

    Pengpeng LI, Bing WANG, Yingde WANG. Ultrafast CO Sensor Based on Flame-annealed Porous CeO2 Nanosheets for Environmental Application [J]. Journal of Inorganic Materials, 2021, 36(11): 1223
    Download Citation