
Pengpeng LI, Bing WANG, Yingde WANG. Ultrafast CO Sensor Based on Flame-annealed Porous CeO2 Nanosheets for Environmental Application [J]. Journal of Inorganic Materials, 2021, 36(11): 1223
- Journal of Inorganic Materials
- Vol. 36, Issue 11, 1223 (2021)
Abstract
Carbon monoxide (CO) which is colorless, odorless, but toxic, explosive, mainly produced by automotive emissions, coal combustion and forest fires etc.[
Many materials could be used to detect CO gas[
Two-dimensional nanosheets exhibit superiority in specific surface area, mobility of ions and the number of active sites, being applied in many aspects[
In this study, we prepared CeO2 NSs via flame annealing under different time intermediate product CeCO3OH nanosheets synthesized by simple hydrothermal method. The as-prepared samples were characterized by various methods. These flame-annealed CeO2 NSs show ultrafast response/recovery time towards CO, wide-range CO detection as well as good reproducibility and selectivity. Moreover, the mechanism of CO gas sensing is discussed.
1 Experimental
1.1 Materials
Cerium (Ⅲ) chloride heptahydrate (CeCl3·7H2O) and sodium oleate were purchased from Shanghai Macklin Biochemical Co., Ltd. Ammonium hydroxide (NH3·H2O) and cyclohexane were provided by Sinopharm Chemical Reagent Co., Ltd. All of the chemicals and solvents were reagent-grade without further purification. Deionized water was used in all procedure.
1.2 Synthesis of CeO2 nanosheets
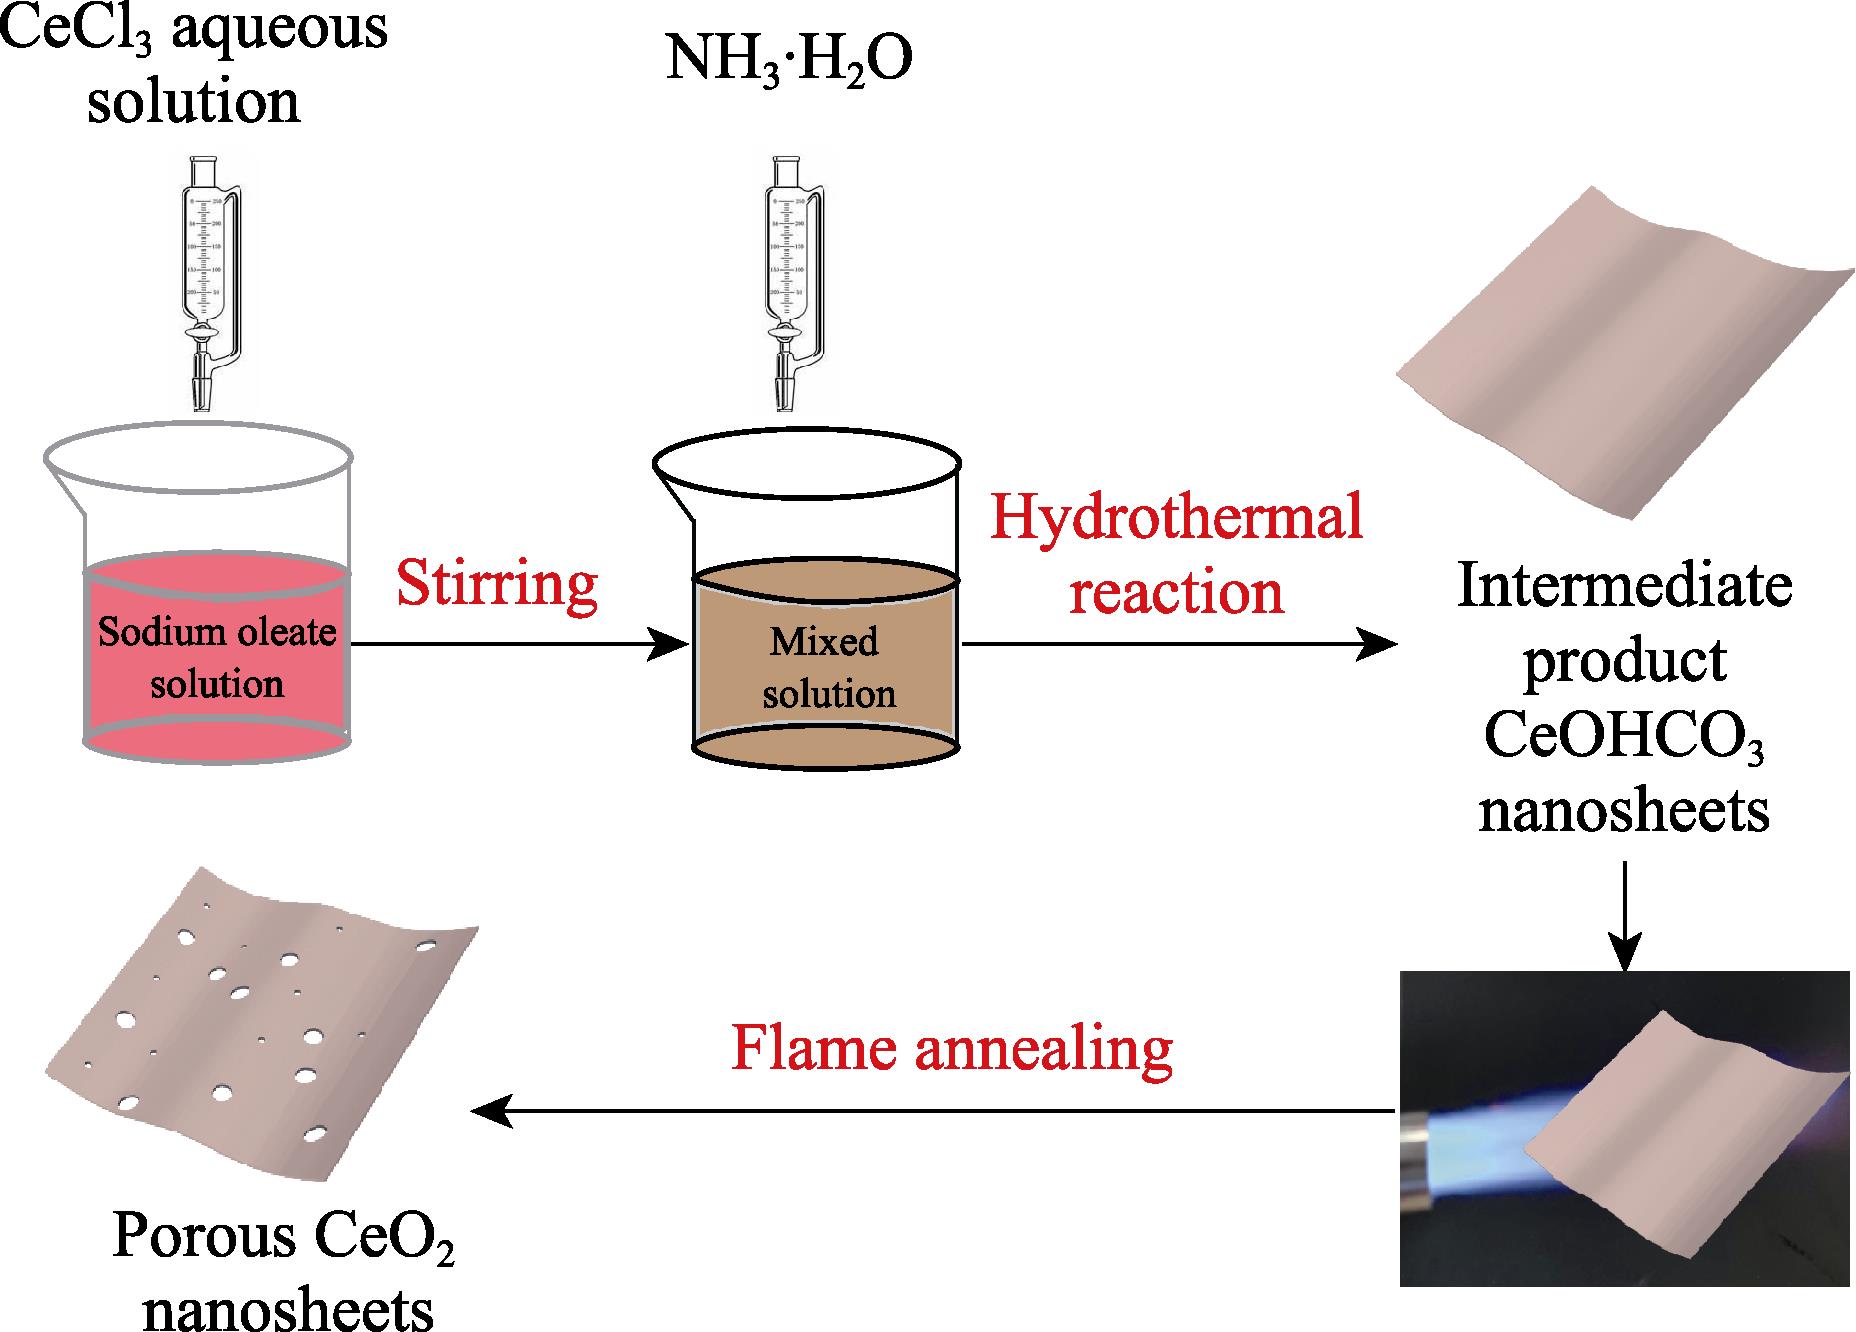
Intermediate product CeCO3OH was synthesized by a simple hydrothermal method according to our previous work[
![]()
Figure 1.Schematic illustration of preparation of CeO2 nanosheets
1.3 Characterization
The crystal structure was confirmed by X-ray Diffraction (XRD, Bruker AXS D8 Advanced Diffractometer, German) with Cu Kα radiation (λ=0.15418 nm). The morphology and structures were characterized via transmission electron microscope (TEM, Tian G2 60-300, FEI, USA). The element compositions and chemical states were obtained by X-ray photoelectron spectroscope (XPS, Thermo Scientific Escalab 250Xi, USA) equipped with a monochromatic Al Kα source. The specific surface area and porosity were evaluated using an automated surface area and pore size analyzer (Quantachrome Autosorb iQ3, USA), calculated by Brunauer-Emmett-Teller (BET) and Barrett-Joyner-Halenda (BJH) methods on the basis of nitrogen adsorption-desorption isotherms, respectively. The presence of oxygen vacancies was determined using electron paramagnetic resonance (EPR, Bruker A300, German).
1.4 Gas sensing test
Specialized CGS-1 TP intelligent gas sensing analyzing system (Beijing Elite Tech Co., Ltd, Beijing, China) was adopted in this work and the fabrication detail and testing principal could be found in our previous report[
where Ra and Rg represent the resistance of sensing materials in air and target gas, respectively. The response and recovery time were labelled as the time to reach 90% of the total resistance change.
2 Results and discussion
2.1 Characterization
In order to identity the crystal structure, the intermediate product and the as-prepared CeO2 nanosheets were carefully investigated by XRD. The patterns of intermediate product perfectly matches with CeCO3OH (JCPDF 32-0189) as shown in Fig. S1. XRD patterns of CeO2- 0.5min NSs, CeO2-2min NSs and CeO2-5min NSs show sharp diffraction peaks, which demonstrates high crystallinity as shown in Fig. 2. These diffraction peaks can be well indexed to cubic fluorite cerium oxide (JCPDF 34-0394). The typical peaks located at 2θ=28.6°, 33.0°, 47.5°, 56.3°, 59.1°, 69.4°, 76.7°, 79.0°, correspond to (111), (200), (220), (311), (222), (400), (331), (420) crystal planes of fluorite phase of CeO2, respectively. However, the width of main diffraction peak of (111) at 2θ=28.6° is quite different. With flame annealing time increasing, the diffraction peak width become narrower, demonstrating the increment of crystal sizes. The crystal sizes based on (111) crystal plane of CeO2-0.5min NSs, CeO2-2min NSs and CeO2-5min NSs were calculated to be 12.12, 17.02 and 20.32 nm, respectively, according to the Scherer equation.
![]()
Figure 2.XRD patterns of the flame-annealed CeO2 nanosheets
The element compositions and surface chemical states could be detected by XPS, and the details are given in Fig. 3. For O element, the O1s core level spectra of CeO2- 0.5min NSs, CeO2-2min NSs and CeO2-5min NSs can be deconvolved into three peaks, i.e. lattice oxygen (OL, ca. 529.0 eV), deficient oxygen (OV, ca. 529.5 eV) and sorbed oxygen (OS, ca. 531.2 eV) in Fig. 3(a, b, c), respectively[
![]()
Figure 3.XPS spectra of the CeO2 NSs (a, b, c) high resolution spectra of O 1s of CeO2-0.5min NSs, CeO2-2min NSs and CeO2-5min NSs; (d, e, f) high resolution spectra of Ce 3d of CeO2-0.5min NSs, CeO2-2min NSs and CeO2-5min NSs
The morphology and structure were characterized by TEM. The spectra of CeO2-0.5min NSs, CeO2-2min NSs and CeO2-5min NSs are given in Fig. 4(a, b, c), respectively, which are transparent nanosheets with pores (labelled by red dotted circles). Nevertheless, there is a difference in pore diameters that with the increase of flame time, the pore diameter becomes larger. This result is consistent with the tendency of nitrogen adsorption-desorption discussed later, which may influence the gas sensing performance. More importantly, with the increment of flame annealing time, the grain sizes become larger, which is consistent with the results of XRD. The crystal structure and crystal lattice spacing of the samples can be observed by HRTEM, as shown in Fig. 4(d,e,f), respectively. The distance of two adjacent crystal planes is 0.31 nm, corresponding to (111) planes of the CeO2 fluorite phase. Obviously, crystallinity increases along with a longer flame annealing time.
![]()
Figure 4.Morphologies and structure characterizations of the as-prepared samples(a, b, c) TEM images of CeO2-0.5min NSs, CeO2-2min NSs and CeO2-5min NSs (pores are labelled by red dotted circles); (d, e, f) HRTEM images of CeO2-0.5min NSs, CeO2-2min NSs and CeO2-5min NSs
Nitrogen adsorption-desorption isothermal curves were performed to characterize the aspect surface area and porosity of the samples, as shown in Fig. 5. It is observed from Fig. 5(a) that all samples exhibit the isotherm feature of the IV-type with a hysteresis loop according to the IUPAC classification, which indicates the existence of a mesoporous structure in nanosheets[
![]()
Figure 5.(a) Nitrogen adsorption-desorption isotherms and (b) pore size distributions of CeO2 NSs
To further verify the presence of oxygen vacancies, EPR were performed to ascertain relative amount of oxygen vacancies in each sample, as shown in Fig. 6. The value of g represents different species which contain unpaired electron. In this case, all samples have the same value of g(2.0038), which typically demonstrates the presence of oxygen vacancies in the samples[
![]()
Figure 6.EPR spectra of CeO2 NSs
2.2 Gas sensing properties
We systematically investigated the gas sensing performances of the samples, as shown in Fig. 7. First of all, the response of the sensors towards 500 μL/L CO were measured from 300 ℃ to 500 ℃ with the interval of 50 ℃ to determine the optimal temperature. For CeO2-2min NSs and CeO2-5min NSs, the optimal temperature is 450 ℃, and that for CeO2-0.5min NSs is 400 ℃ in Fig. 7(a). However, the responses of CeO2-2min NSs (10%) and CeO2-5min NSs (9%) are far higher than that for CeO2- 0.5min NSs (4%). The responses of CeO2-2min NSs and CeO2-5min NSs are considerable, which may be ascribed to the comparable OV content demonstrated by XPS (Table S1, 43.2% and 42.7%, respectively) and EPR (Fig. 6). For a little higher response of CeO2-2min NSs than CeO2-5min NSs, the difference between surface area (Table S2) and the content of Ce3+ (Table S1) may account for it. However, there is a large gap between the response of CeO2-2min NSs and CeO2-0.5min NSs, which may be resulted from the discrepancy of the amount of OV (Table S1 and Fig. 6) and pore diameters (Fig. 5(b)). Therefore, CeO2-2min NSs was chosen to proceed further testing at its optimal temperature(450 ℃).
![]()
Figure 7.Gas sensing properties of CeO2 NSs (a) Response of CeO2 NSs at different temperatures from 300 ℃ to 500 ℃ with an interval of 50 ℃ towards 500 μL/L CO; (b) Response of CeO2-2min NSs towards 500 μL/L CO at 450 ℃ for seven periods; (c) Transient response of CeO2-2min NSs towards different concentration from 10 μL/L to 10000 μL/L at 450 ℃; (d) Fitting of CO concentration and its corresponding response; (e) Determination of response/recovery time of CeO2-2min NSs towards 500 μL/L CO at 450 ℃; (f) Selectivity of CeO2-2min NSs towards CH4, H2, NH3, NO2 and CO at 450 ℃
Reproducibility is a basic requirement for gas sensors to practical application. 500 μL/L CO at 450 ℃ was adopted to test reproducibility. In Fig. 7(b), it is found that the response of 7-time testing is stable without any decrease. It demonstrates that CeO2-2min NSs possesses well reproducible ability in CO gas sensing.
Relationship between CO concentration and its response is important to determine real CO concentration in CO gas sensor applications. Different concentration of CO was subject to test at 450 ℃ as shown in Fig. 7(c). The highest concentration of the test is 10000 μL/L, and with the decrease of the concentration, the response also declines. Meanwhile, the lowest concentration tested is 10 μL/L with the response of 1.5%. Furthermore, the response and the concentration of CO (10-10000 μL/L) is fitted as shown in Fig. 7(d) and it keeps functional relationship of y=1.09x0.45 with R2=0.9908. It proves that CeO2-2min NSs is a promising material in CO gas sensing with a wide range. In addition, it is impressive that the response/recovery time are ultrafast in the sensing procedure, which is expected for a gas sensor.
To investigate response/recovery time carefully, we chose a cycle of transient response in reproducibility test for further research. As can be seen in Fig. 7(e), the response and recovery time are both 2 s, which is very short in gas sensing. As discussed above, carriers on nanosheets move quickly because the morphology constraints its pathway in planes. In this case, electrons move in planes of CeO2 nanosheets, which promises ultrafast response/recovery time. Therefore, it is reasonable to deem that CeO2-2min NSs is advantageous in CO gas sensing. Moreover, recent progresses in CO gas sensing are summarized in Table 1, and it is concluded that CeO2-2min NSs outperforms in response/recovery time.
| OS/% | OV/% | Ce3+/% | Ce3+/Ce4+ | |
|---|---|---|---|---|
| CeO2-0.5min NSs | 19.0 | 40.0 | 26.3 | 0.357 |
| CeO2-2min NSs | 14.8 | 43.2 | 28.6 | 0.401 |
| CeO2-5min NSs | 15.1 | 42.7 | 23.8 | 0.312 |
Table 1.
Percentage of each element species to the whole element content
Selectivity is a valuable index to evaluate gas sensor. We also studied the selectivity of CeO2-2min NSs in gas sensing was studied as presented in Fig. 7(f). 500 μL/L of CH4, H2, NH3, NO2 and CO are subject to test, and it is found that the response of CO is much higher than that to other gases. Therefore, CeO2-2min NSs is very promising in CO gas sensing.
In addition, it is noticed that humidity has obvious impact on CeO2-2min NSs response (Fig. S2), namely high humidity for low response, which may be arisen from the water molecules occupy the active sites on CeO2 NSs at high humidity. Besides, long-term stability of CeO2-2min was also performed as shown in Fig. S3. Although the response has a small decrease in two weeks, long-term stability is improved by doping or coating in followup work.
2.3 Gas sensing mechanism
The gas sensing mechanism of CeO2 NSs follows a surface charge model, which can be explained by the change of resistance in different target gases, as shown in Fig. 8[
![]()
Figure 8.Schematic illustration of CO gas sensing mechanism Yellow spheres represent O atoms; Orange spheres represent Ce atoms; Red rings represent the position of oxygen vacancies
During this reaction, the release of electrons into the surface of CeO2 NSs increases the concentration of carriers, leading to a thinner depletion layer as well as a decrease of resistance.
In this case, CeO2-2min NSs possesses the largest part of OV, which is the active site for facilitating oxygen adsorption and dissociation by providing unpaired electrons[
3 Conclusion
In summary, CeO2 NSs via flame annealing intermediate product CeCO3OH nanosheets was synthesized by hydrothermal method with different flame time. Wherein, CeO2-2min NSs showed superb gas sensing performances. The response/recovery time were only 2 s/2 s, which was ultrafast in gas sensing field. In addition, CO concentration and its response kept well functional relationship at a wide detection range. Moreover, reproducibility and selectivity were also decent. The good performances are attributed to more oxygen vacancies and porous nanosheets morphology. As a result, this CeO2 NSs is reliable to apply in CO gas sensing. Meanwhile, flame annealing provides a novel method to prepare nanomaterials with simplicity and low cost.
Supporting materials
![]()
Figure S1.XRD pattern of the intermediate product
![]()
Figure S2.Response of CeO2-2min NSs towards 500 μL/L CO at 450 ℃ under different humidities
![]()
Figure S3.Long-term stability of CeO2-2min NSs towards 500 μL/L CO at 450 ℃ for two weeks
| Surface area/(m2∙g-1) | Pore volume/
| Average pore diameter/nm | |
|---|---|---|---|
| CeO2-0.5min NSs | 73.344 | 0.172 | 10.1 |
| CeO2-2min NSs | 46.804 | 0.181 | 15.5 |
| CeO2-5min NSs | 40.836 | 0.163 | 15.8 |
Table 2.
Summary of surface area and pore volume of CeO2 NSs
Table Infomation Is Not EnableReferences
[3] WHO Air Quality Guidelines-Global Update 2005. World Health Organization, Copenhagen(2006).
[4] S YANG, C JIANG, H WEI S. Gas sensing in 2D materials. Applied Physics Reviews, 4, 021304(2017).
[8] C SUN, H LI, L CHEN. Nanostructured ceria-based materials: synthesis, properties, and applications. Energy & Environmental Science, 5, 8475-8505(2012).
[19] H YUAN, S ALJNEIBI, J YUAN et al. ZnO nanosheets abundant in oxygen vacancies derived from metal-organic frameworks for ppb-level gas sensing. Advanced Materials, 31, e1807161(2019).
[31] Z WANG, R YU. Hollow micro/nanostructured ceria-based materials: synthetic strategies and versatile applications. Advanced Materials, 31, e1800592(2019).

Set citation alerts for the article
Please enter your email address
© Copyright 2018-2021 | Chinese Laser Press. All Rights Reserved 沪ICP备15018463号-20