• Laser & Optoelectronics Progress
  • Vol. 57, Issue 12, 122804 (2020)
Meijie Yang and Jun Liu*
Author Affiliations
  • College of Urban Rail Transit, Shanghai Engineering Science University, Shanghai 201620, China
  • show less
    DOI: 10.3788/LOP57.122804 Cite this Article Set citation alerts
    Meijie Yang, Jun Liu. Influence of Distance Factor onthe Scanning Accuracy of Terrestrial Laser[J]. Laser & Optoelectronics Progress, 2020, 57(12): 122804 Copy Citation Text show less
    Experiment of laser intensity and scanning distance. (a) Schematic; (b) real scene; (c) intercepting target data
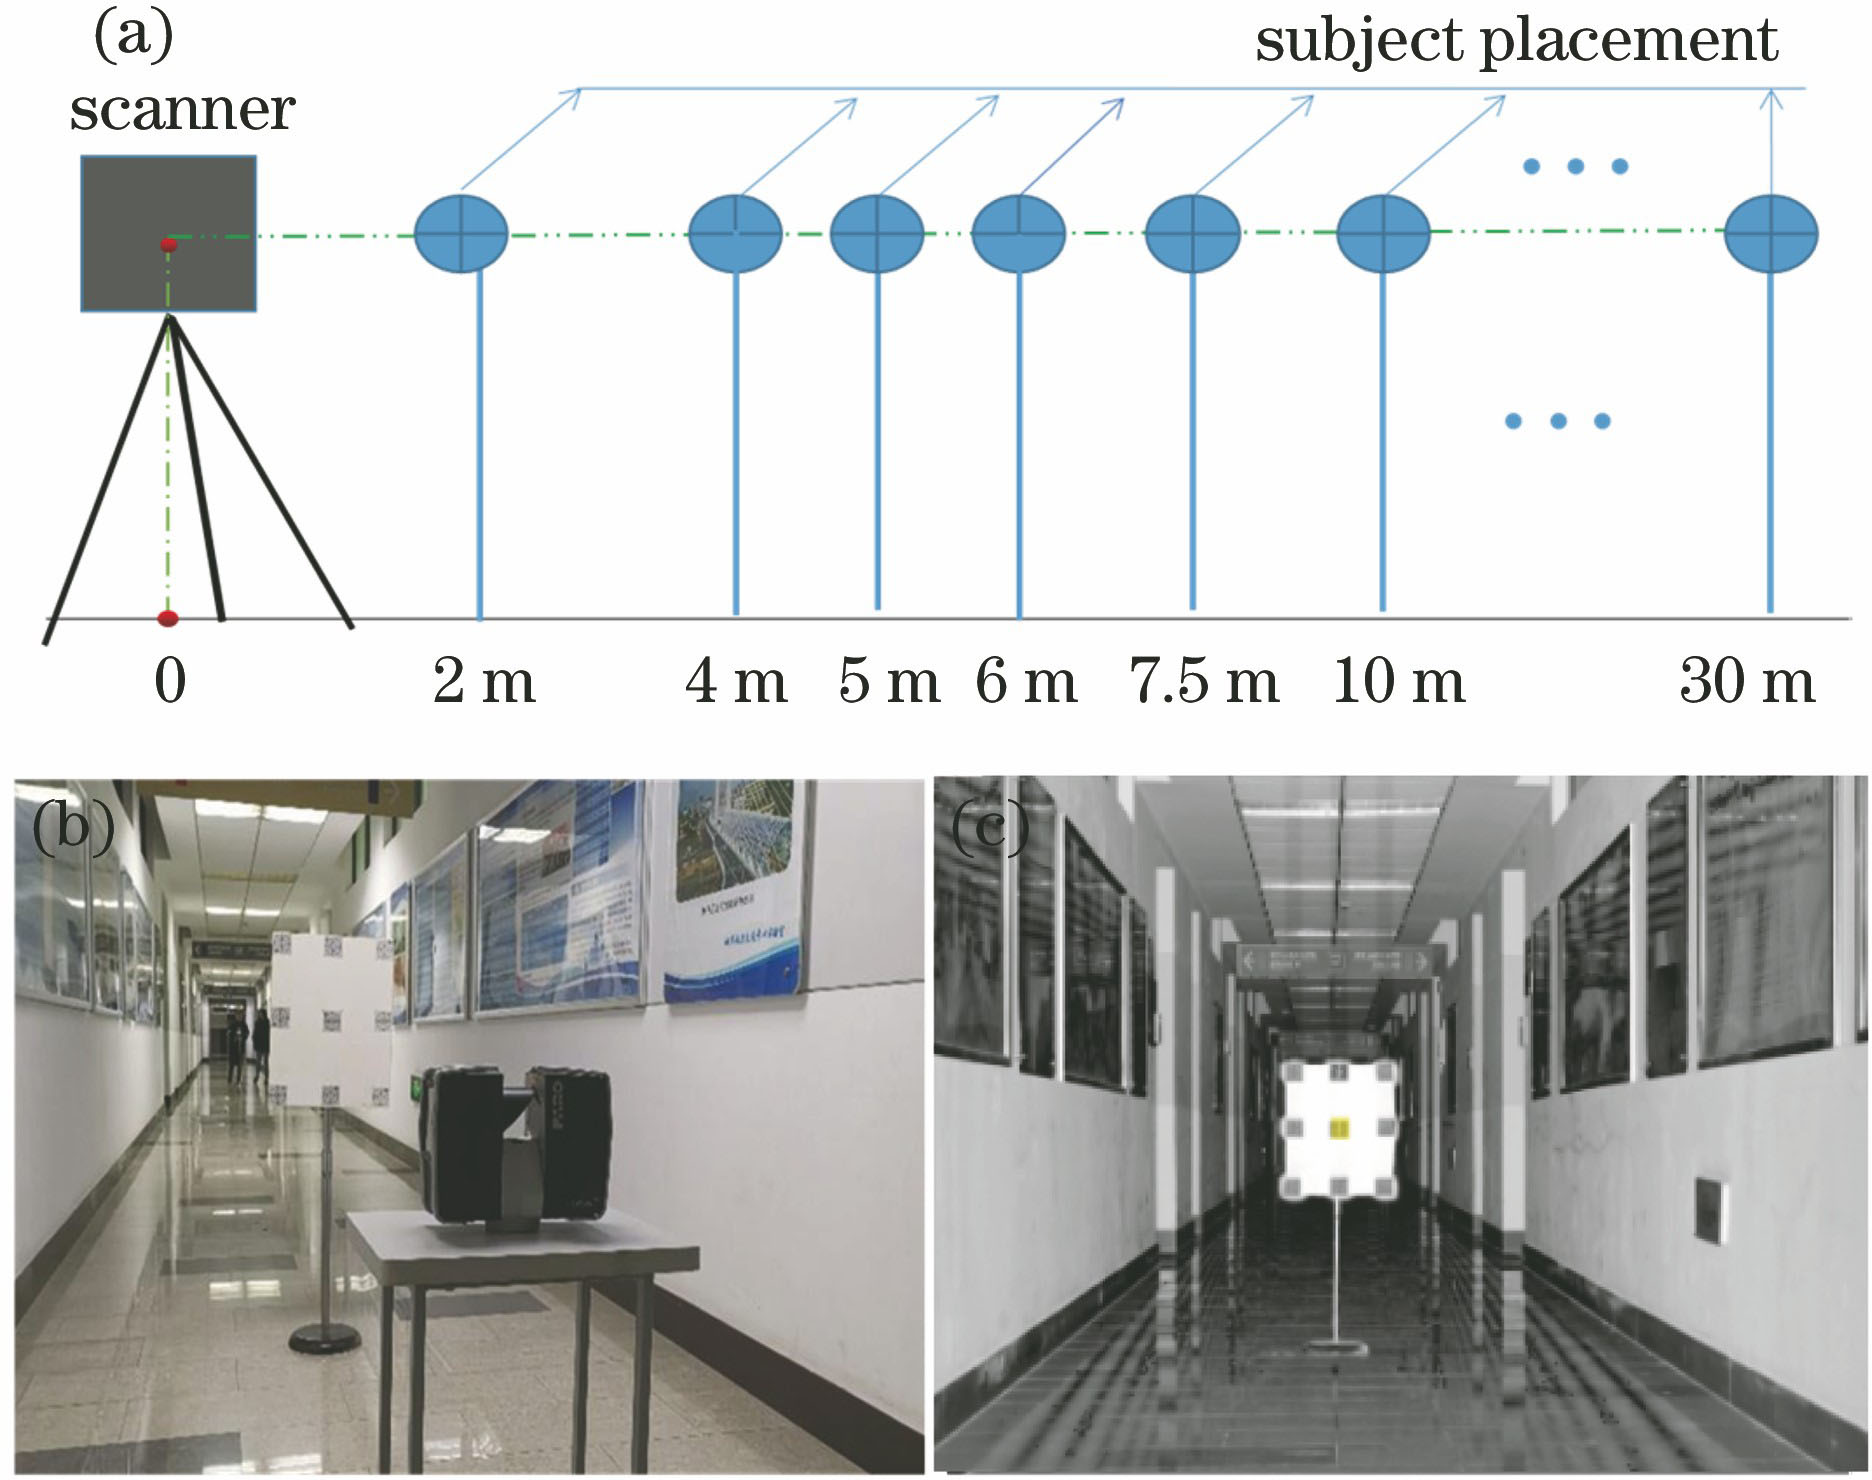
    Fig. 1. Experiment of laser intensity and scanning distance. (a) Schematic; (b) real scene; (c) intercepting target data
    Experimental scene. (a) Indoor experimental scene; (b) schematic diagram of four-color cardboard combination; (c) lawn scene; (d) ground scene (inside red line frame)
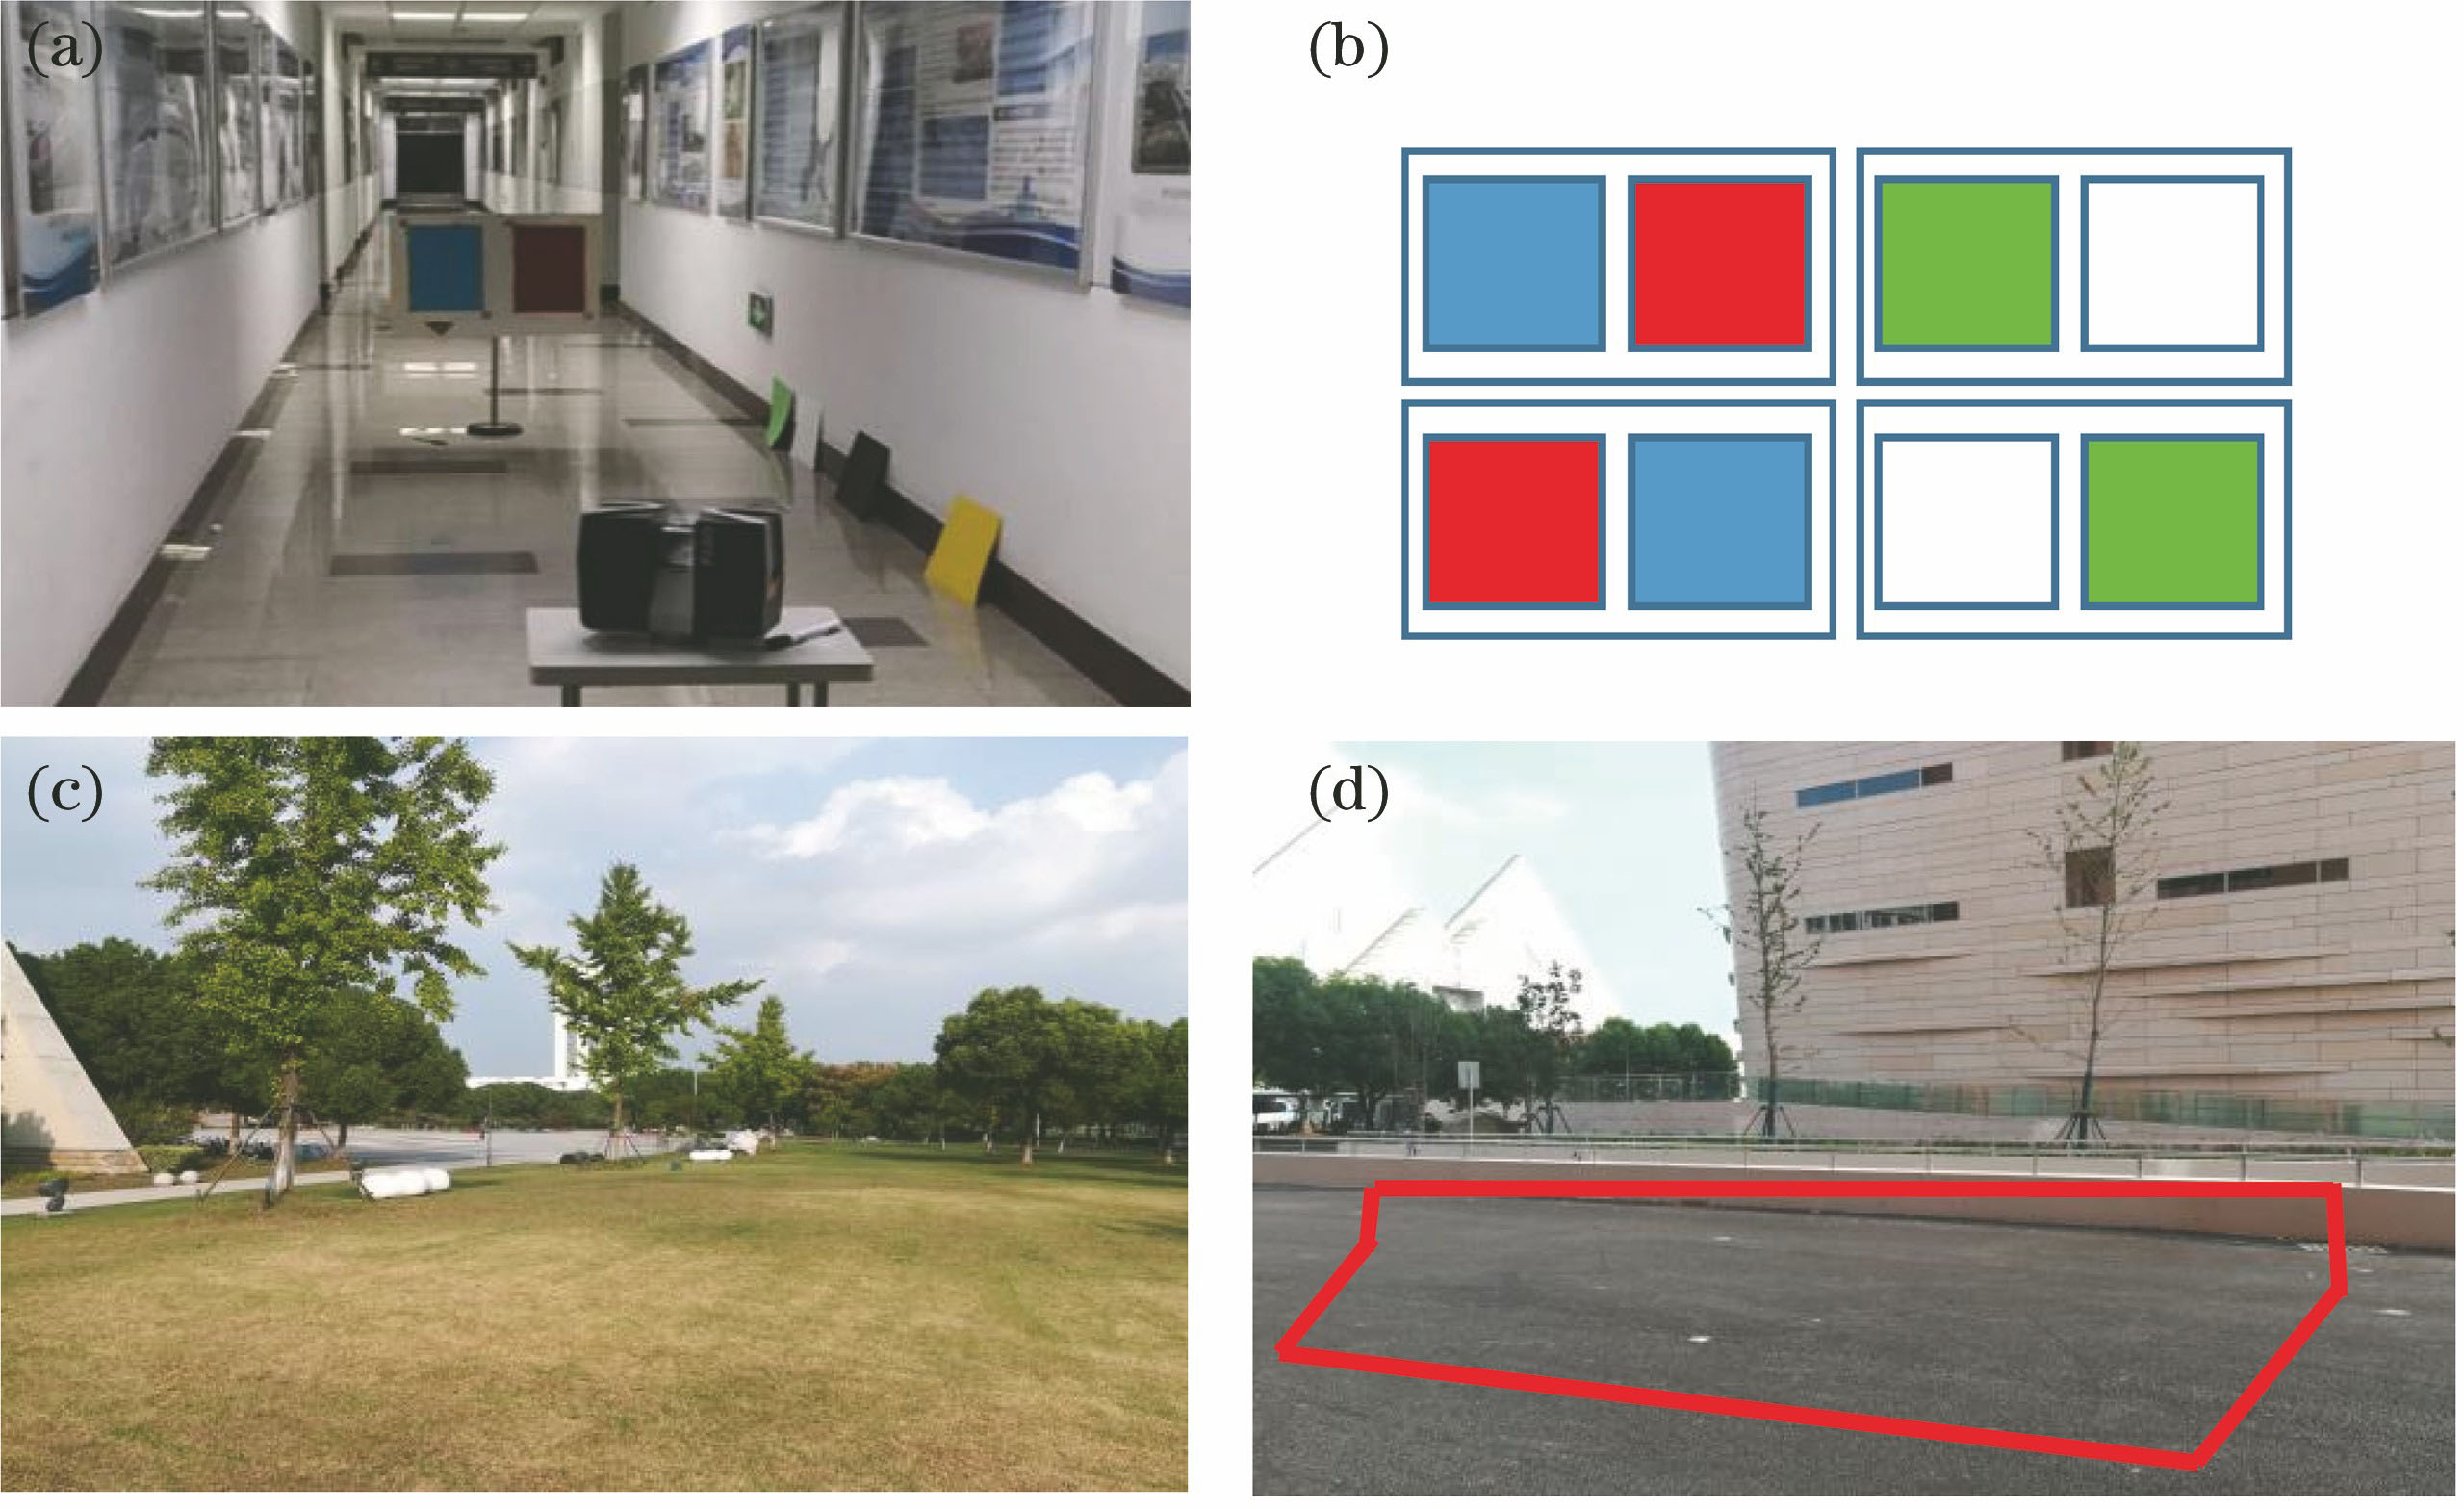
    Fig. 2. Experimental scene. (a) Indoor experimental scene; (b) schematic diagram of four-color cardboard combination; (c) lawn scene; (d) ground scene (inside red line frame)
    RGB value of point cloud intensity for lawn scene before and after correction. (a) Before correction; (b) modified sectional polynomial model; (c) modified Taylor interpolation polynomials model; (d) modified the mixed model of sectional Gaussian function and polynomial
    Fig. 3. RGB value of point cloud intensity for lawn scene before and after correction. (a) Before correction; (b) modified sectional polynomial model; (c) modified Taylor interpolation polynomials model; (d) modified the mixed model of sectional Gaussian function and polynomial
    RGB value of point cloud intensity for ground scene before and after correction. (a) Before correction; (b) modified sectional polynomial model; (c) modified Taylor interpolation polynomials model; (d) modified the mixed model of sectional Gaussian function and polynomials
    Fig. 4. RGB value of point cloud intensity for ground scene before and after correction. (a) Before correction; (b) modified sectional polynomial model; (c) modified Taylor interpolation polynomials model; (d) modified the mixed model of sectional Gaussian function and polynomials
    Emittedpower /mWWavelength /nmBeamdiameter /mmField ofview /(°)×(°)Beamdivergence /(°)Rang /m
    209053.8360×3050.0090.6—120
    Table 1. Main parameters of FARO Focus3D 120
    Fitting functionParameterFirst halfParameterSecond half
    SSER-squareRMSESSER-squareRMSE
    Polynomial161730.574738.16190.620.9565.35
    260890.589238.25284.320.9636.467
    382.2300.99335.39436.5460.9982.409
    452.0910.99745.120----
    57.9820.99932.562----
    Power function----181.230.9615.097
    Exponential----189.530.9585.431
    function----253.150.9787.289
    Fourier function17.3540.99891.811184.970.9639.249
    Gaussian17.5220.99951.954----
    function20.02310.120185.430.9616.451
    TaylorpolynomialWhole curve
    Interpolation0.020910.098Last two points are reserved to calculate theroot mean square error of the fitting function
    Table 2. Reflection intensity data fitting table
    ItemBlueRedGreenWhiteLawnsceneGroundscene
    LeftRightLeftRightLeftRightLeftRight
    R/mmin5.9475.9635.9415.9355.9425.9475.9545.9411.9481.998
    max5.9715.9445.9655.9645.9715.9625.9935.96330.2510.10
    Imin1943194219411943194419451938194816481325
    max1950195019521955195119521953195620351789
    A minA max18621865186118661868187518691873186718711866186918691878186918741825191114651568
    B minB max19491955195219591949195719431951195419601954196219561968195619631836195515461689
    C minC max17851793178517921761176717591770173017351728173617261738172517341767196513981584
    D minD max17881799175617811683169016501661168416911729173517791796175017641694200513681656
    MeanOriginal1946194619471948194719481949195218951548
    A1864186518711870186918671874187218661543
    B1952195819531948195719581966195819031563
    C1789178617651768173417241735172918691458
    D1793176816861658168917321786175818891435
    STDOriginal2.3570.1220.0901.2692.1620.7660.4234.112669.5469.3
    A0.2020.0420.0080.1350.2460.1980.0970.69535.6645.44
    B0.2680.0790.0280.6840.6820.6540.1651.11578.3582.5
    C1.8570.1020.0640.7891.1210.7250.2214.35698.76101.5
    D2.6840.1651.351.1471.6840.7540.5544.451389.2205.7
    Table 3. Distribution of original intensity and corrected intensity
    Meijie Yang, Jun Liu. Influence of Distance Factor onthe Scanning Accuracy of Terrestrial Laser[J]. Laser & Optoelectronics Progress, 2020, 57(12): 122804
    Download Citation