• Spectroscopy and Spectral Analysis
  • Vol. 42, Issue 3, 919 (2022)
Yan JIANG1、1; 2;, He MENG1、1;, Yi-rong ZHAO1、1;, Xian-xu WANG1、1;, Sui WANG1、1;, En-yu XUE3、3;, and Shao-dong WANG1、1; *;
Author Affiliations
  • 11. Northeast Agricultural University/National Soybean Engineering Technology Research Center, Harbin 150030, China
  • 33. Heilongjiang Rural Industry Development Center, Harbin 150036, China
  • show less
    DOI: 10.3964/j.issn.1000-0593(2022)03-0919-05 Cite this Article
    Yan JIANG, He MENG, Yi-rong ZHAO, Xian-xu WANG, Sui WANG, En-yu XUE, Shao-dong WANG. Rapid Analysis of Main Quality Parameters in Forage Soybean by Near-Infrared Spectroscopy[J]. Spectroscopy and Spectral Analysis, 2022, 42(3): 919 Copy Citation Text show less
    Original spectral curve
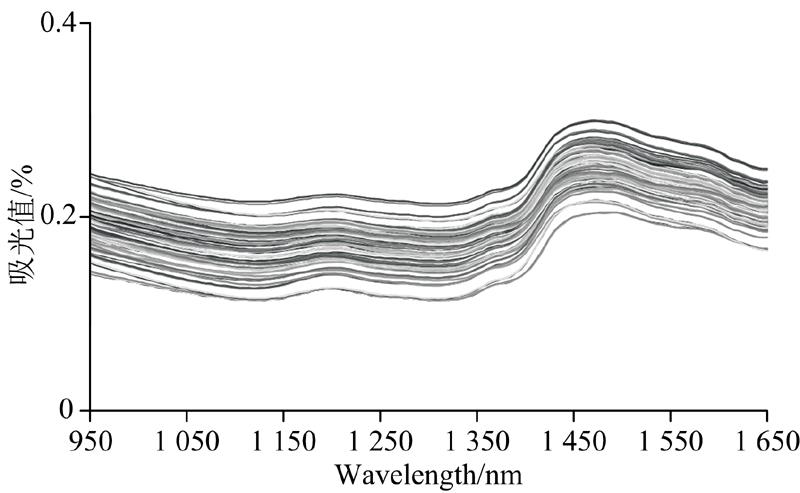
    Fig. 1. Original spectral curve
    PLS model of forage soybean quality by NW1st+DE-trending+SNV treatments
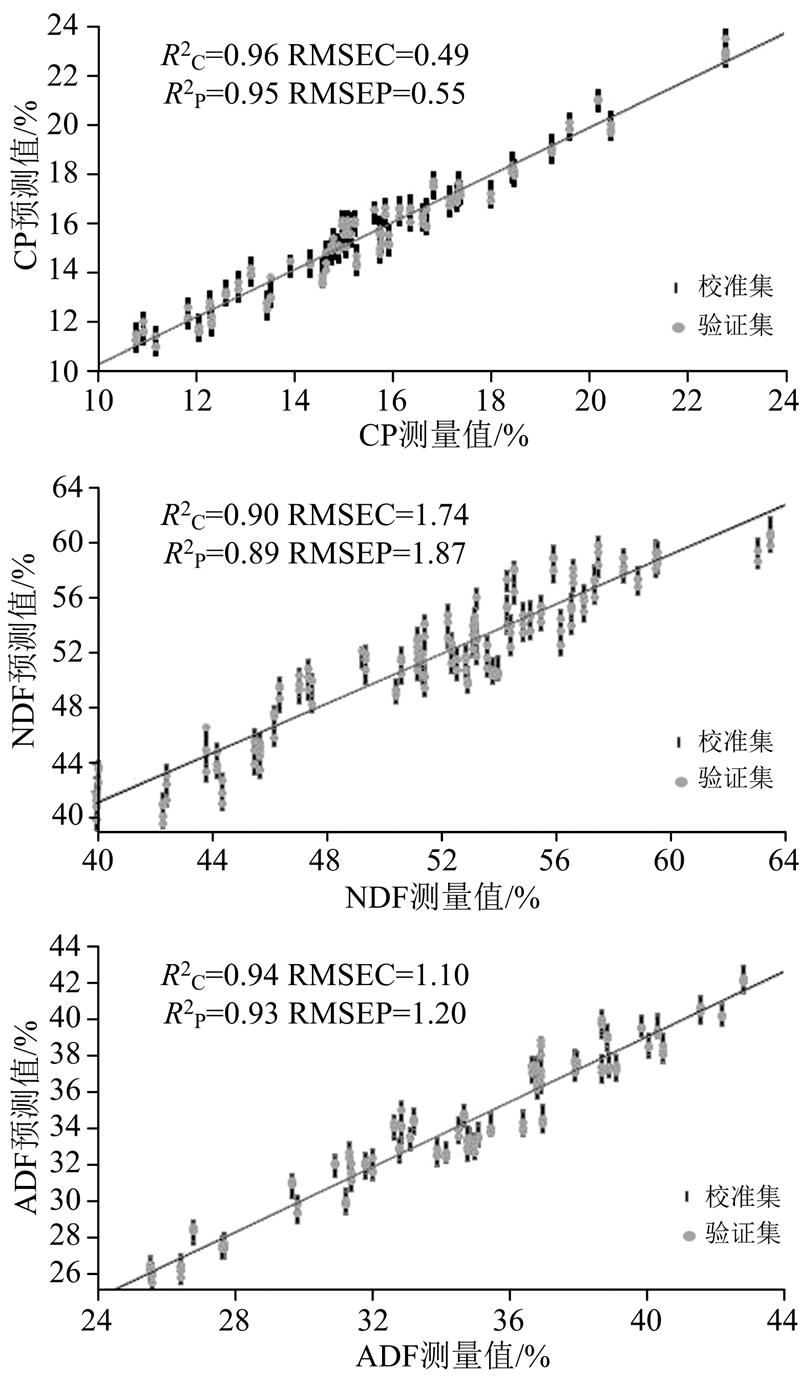
    Fig. 2. PLS model of forage soybean quality by NW1st+DE-trending+SNV treatments
    The full spectrum curve after NW1st+DE-trending+SNV treatments
    Fig. 3. The full spectrum curve after NW1st+DE-trending+SNV treatments
    指标最大值最小值平均值标准差
    CP22.7911.2116.212.04
    NDF63.4841.0251.255.02
    ADF42.5125.0033.884.51
    Table 1. Content statistics of main forage quality indexes in samples (%)
    预处理CPNDFRMSEC
    RMSECRC2RMSEPRP2RMSECRC2RMSEPRP2RMSECRC2RMSEPRP2
    NW1st0.670.930.730.921.970.872.130.851.230.931.340.92
    NW1st+DE0.540.960.610.951.720.901.890.871.200.931.300.92
    NW1st+DE+SNV0.490.960.550.951.740.901.870.891.100.941.200.93
    NW2nd+DE+SNV0.490.960.560.961.710.911.940.881.230.931.320.92
    Table 2. Model results of main quality indexes of whole plants of forage soybean with different pretreatments
    Yan JIANG, He MENG, Yi-rong ZHAO, Xian-xu WANG, Sui WANG, En-yu XUE, Shao-dong WANG. Rapid Analysis of Main Quality Parameters in Forage Soybean by Near-Infrared Spectroscopy[J]. Spectroscopy and Spectral Analysis, 2022, 42(3): 919
    Download Citation