
Xianghua Yu, Chao Liu, Chen Bai, Yanlong Yang, Tong Peng, Dan Dan, Junwei Min, Baoli Yao. Progress in Light-Sheet Fluorescence Microscopy and Applications[J]. Laser & Optoelectronics Progress, 2020, 57(10): 100001
- Laser & Optoelectronics Progress
- Vol. 57, Issue 10, 100001 (2020)
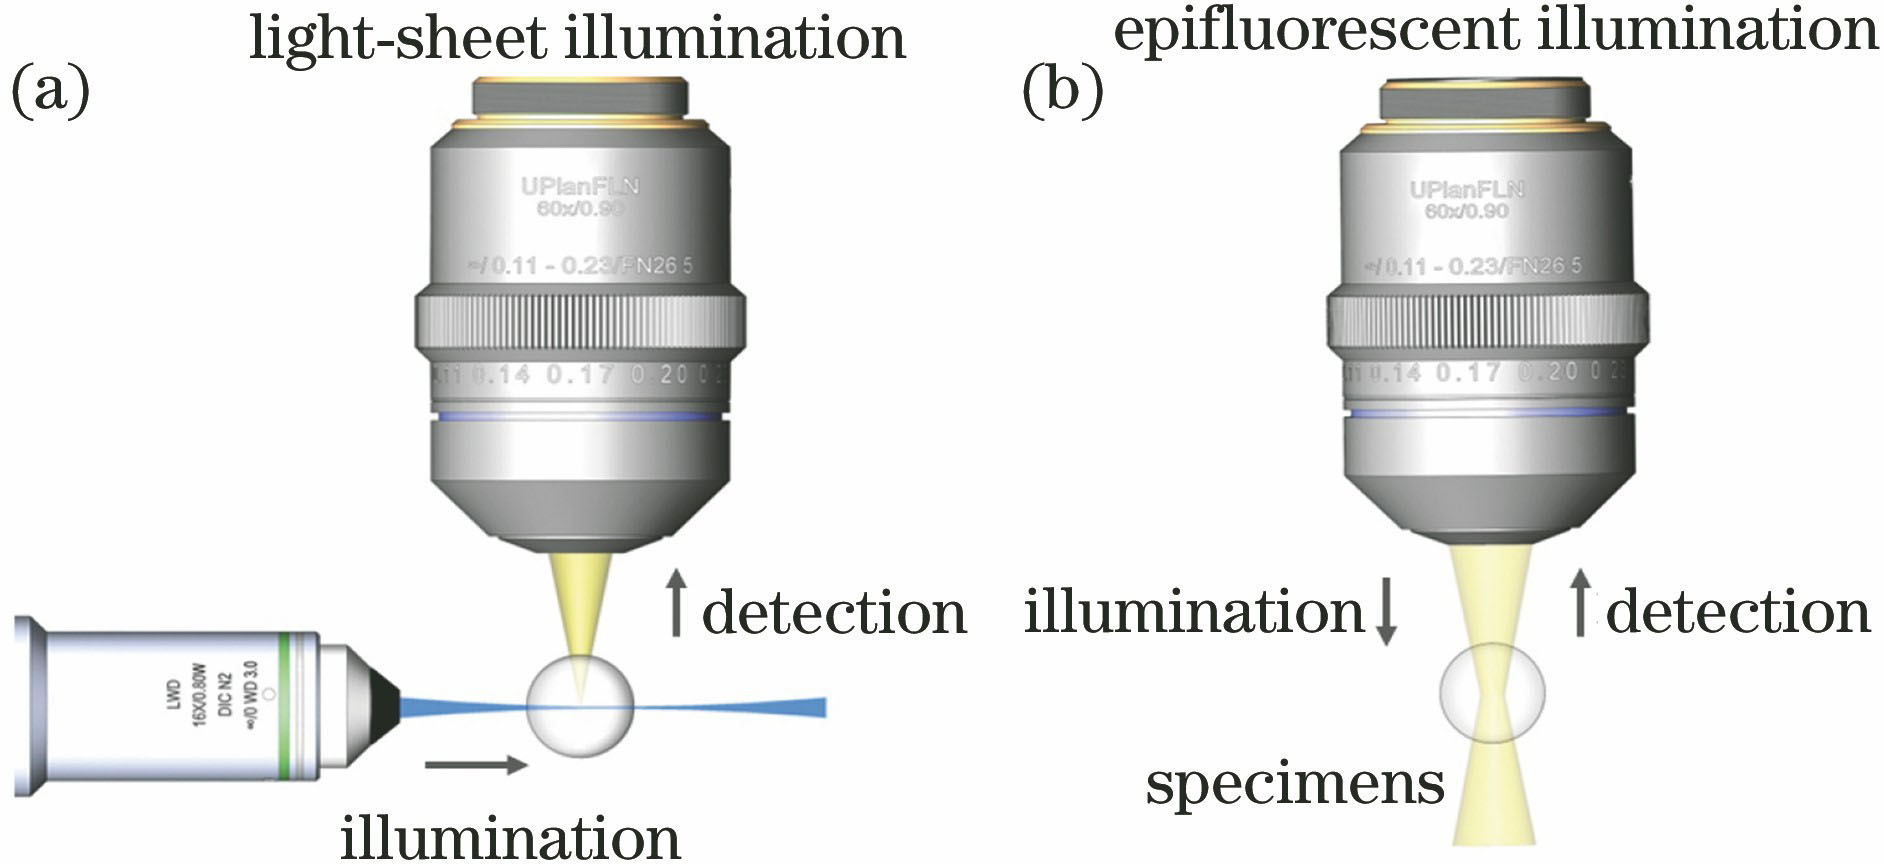
Fig. 1. Comparison of two types of illumination and imaging schemes. (a) LSFM illuminates the sample from the side with a thin light-sheet and captures the optical sectioned image in orthogonal direction by another detection objective; (b) epifluorescence microscopy uses the same objective to illuminate and detect the sample, in which both the in-focus and out-of-focus portions are excited
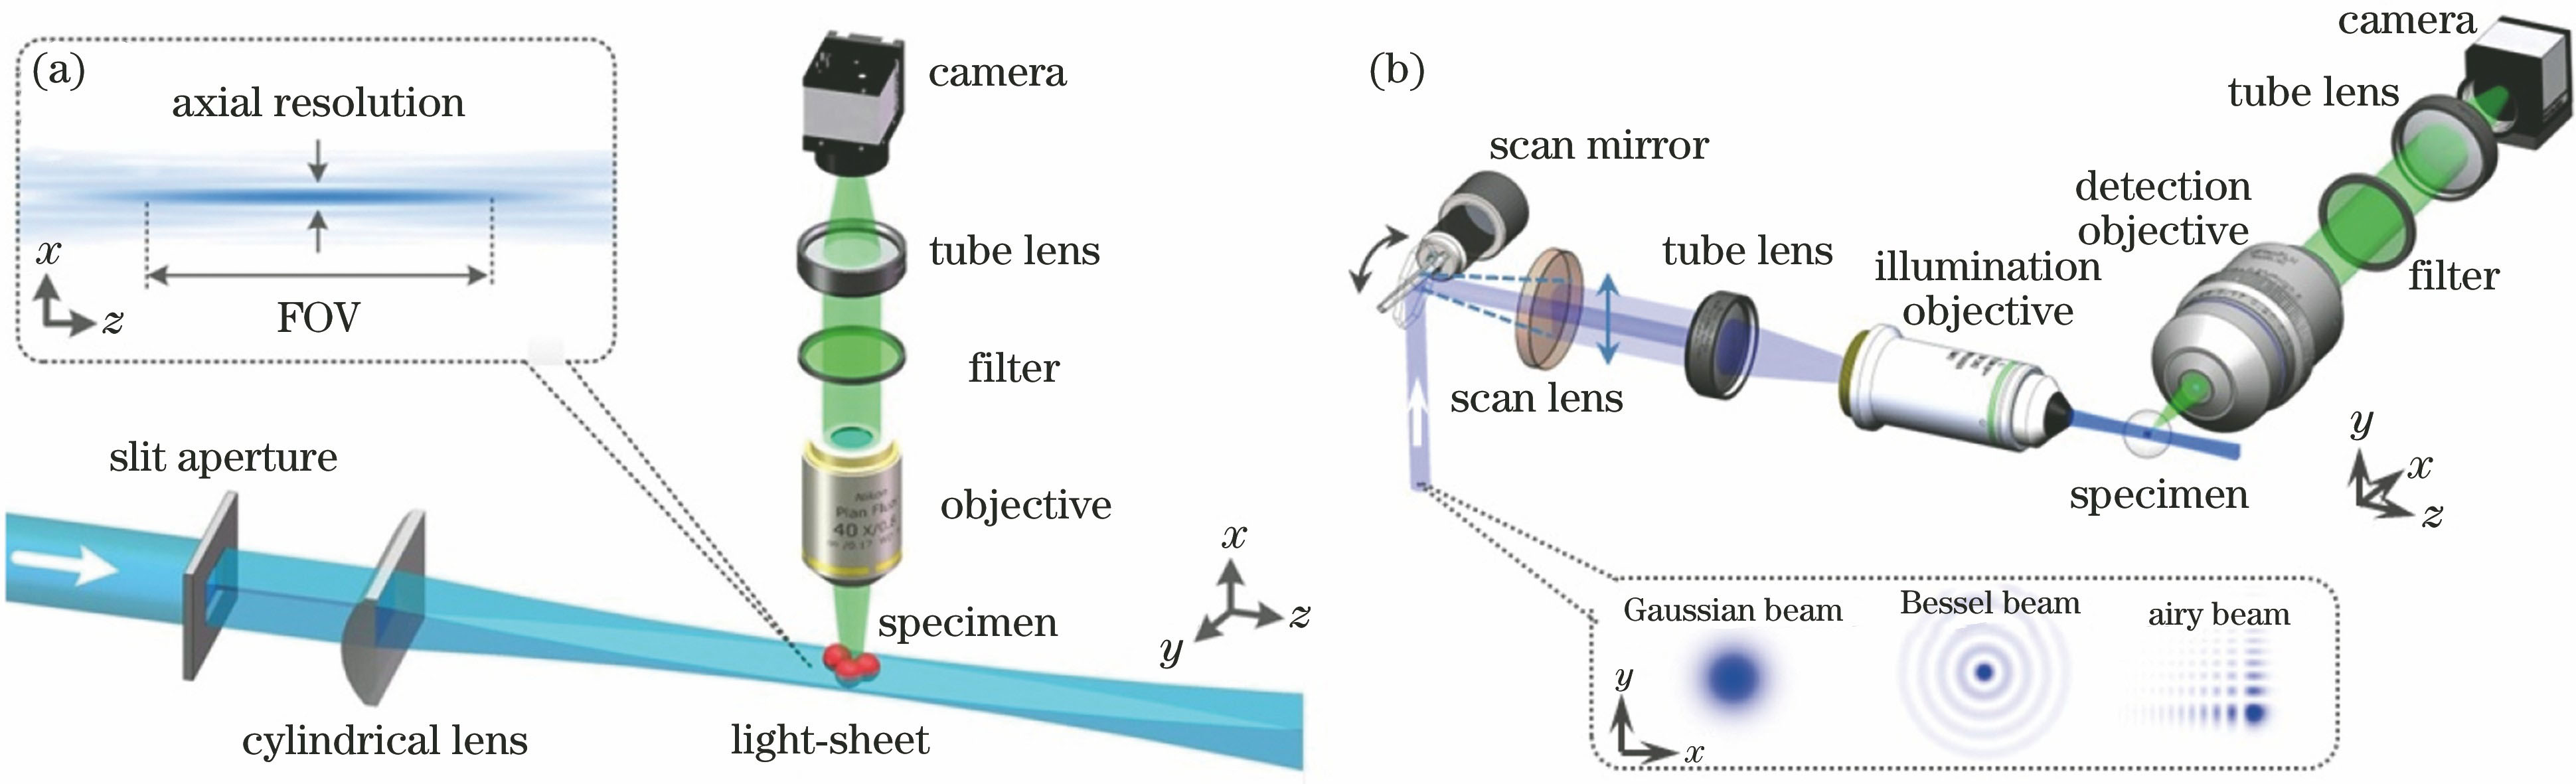
Fig. 2. Schematic diagrams for two types of LSFM with different light-sheet generation schemes. (a) Light-sheet is generated by focusing a laser beam with a cylindrical lens; (b) light-sheet is generated by rapidly scanning a laser beam with a scan mirror. Below are the transversal intensity patterns of various types of incident laser beams
Fig. 3. Comparison of three types of light-sheets[44]. (a) Gaussian light-sheet; (b) nondiffracting Bessel light-sheet; (c) nondiffracting Airy light-sheet
Fig. 4. Schematic diagram of non-diffracting complementary beam subtraction LSFM
Fig. 5. Super resolution light-sheet fluorescence microscopy. (a) Lattice LSFM (LLSFM)[63]; (b) coherent structured illumination LSFM[64]; (c) stimulated emission depletion LSFM[67]; (d) stochastic optical fluctuation imaging LSFM[22]
Fig. 6. Two kinds of light-sheet fluorescence microscopy for fast three-dimensional imaging. (a) Schematic of the objective-coupled planar illumination microscope[69]; (b) concept of decoupled illumination detection in LSFM[74]
Fig. 7. Improving the imaging quality of LSFM by aberration correction. (a) Simplified schematic of adaptive optical lattice light-sheet fluorescence microscopy; (b) imaging results of the spine of a zebrafish embryo before and after aberration correction[77]
Fig. 8. Applications of LSFM in cell biology. (a) Distribution of growth rates at different stages of cell mitosis; (b) 3D spatial relationship of histones (green), mitochondria (yellow), and the endoplasmic reticulum (magenta) at four time points during mitosis; (c) volume renderings at eight consecutive time points of a single specimen of the protozoan T. thermophila[63]
Fig. 9. Applications of LSFM in developmental biology. (a) LSFM 3D images at different stages during the zebrafish embryonic development[12]; (b) LSFM 3D images at different stages during the drosophila embryonic development[10]
Fig. 10. Mice brain imaging via LSFM[68]. (a) Image reconstruction of an entire whole mouse brain; (b) images of an excised whole hippocampus; (c) image reconstruction of a specific part of hippocampus; (d) dendritic spines of the neurons. Scale bar: 500 μm
|
Table 1. Relation of FOV and thickness of Gaussian light-sheet (n=1.33, λill=0.5 μm)

Set citation alerts for the article
Please enter your email address
© Copyright 2018-2021 | Chinese Laser Press. All Rights Reserved 沪ICP备15018463号-20