
Muhammad Usman, Usman Zabit, Olivier D. Bernal, Gulistan Raja. Blind identification of occurrence of multi-modality in laser-feedback-based self-mixing sensor[J]. Chinese Optics Letters, 2020, 18(1): 011201
- Chinese Optics Letters
- Vol. 18, Issue 1, 011201 (2020)
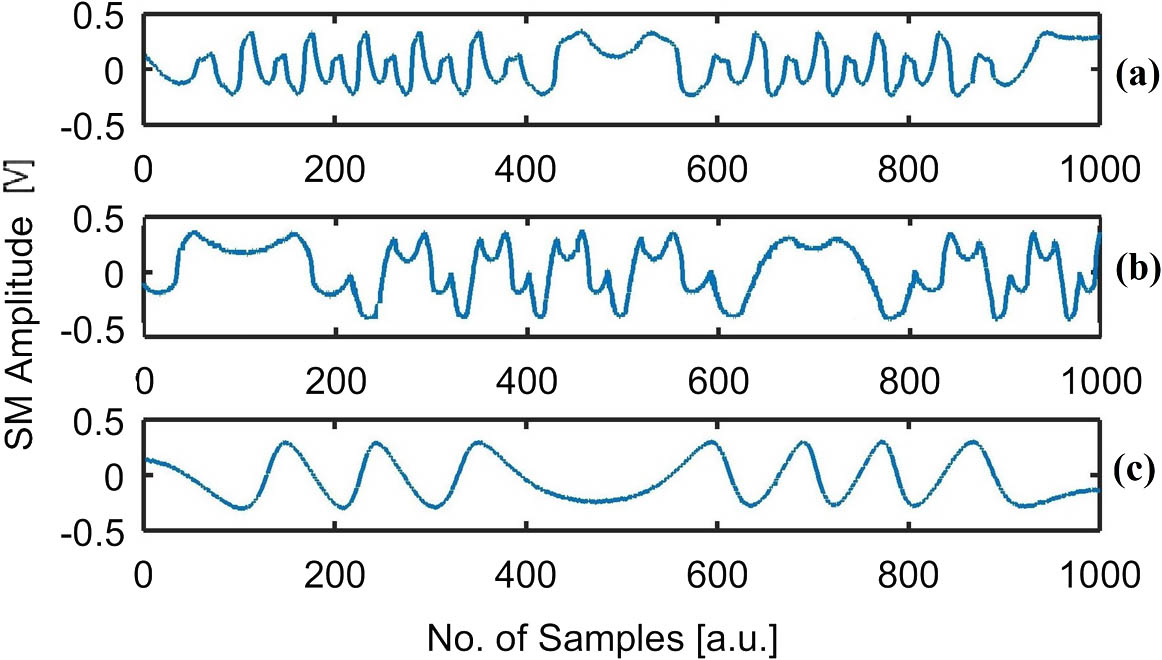
Fig. 1. Experimental (a), (b) multi- and (c) mono-modal SM signals acquired under different OF coupling and operating current conditions based on the HL6501MG LD (
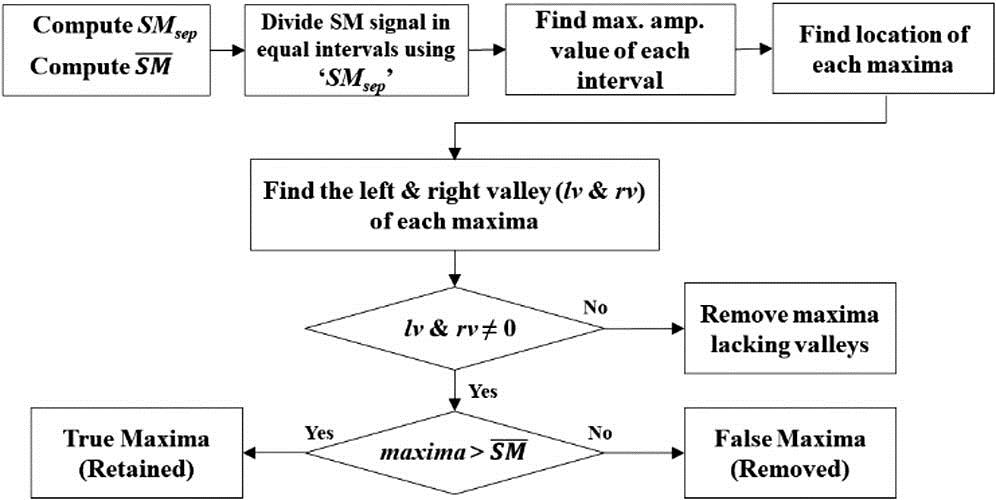
Fig. 2. Flowchart of customized maxima detection technique variations (
Fig. 3. Flowchart of the variance-based technique (VBT).
Fig. 4. Steps of the kurtosis-based technique (KBT), skewness-based technique (SBT), and skewness–kurtosis-based technique (SKBT).
Fig. 5. Evolution of parameters with respect to
Fig. 6. Simulated mono-modal SM signals with SNRs of 10 dB and 40 dB in the case of (a) weak feedback regime (
Fig. 7. Correctly identified experimental mono-modal SM signals.
Fig. 8. Correctly identified experimental (a) bi-modal and (b) tri-modal SM signals.
|
Table 1. Values of Statistical Parameters of Simulated Normalized Mono-Modal SM Signals for Varying SNR under Weak-Feedback Regime for C=0.1 and Amplitude of 5λ0
|
Table 2. Values of Statistical Parameters of Simulated Normalized Mono-Modal SM Signals for Varying SNRs under Moderate-Feedback Regime (C=4) and Amplitude of 5λ0
|
Table 3. Extracted Threshold Values of Proposed Statistical Parameters Based on Simulations on Mono-Modal SM Signals under Varying Optical Feedback, Vibration Amplitude, and Signal to Noise Ratio
|
Table 4. Performance of Proposed Techniques by Testing Experimentally Acquired Dataset of 60 SM Signals

Set citation alerts for the article
Please enter your email address
© Copyright 2018-2021 | Chinese Laser Press. All Rights Reserved 沪ICP备15018463号-20