Muhammad Usman, Usman Zabit, Olivier D. Bernal, Gulistan Raja, "Blind identification of occurrence of multi-modality in laser-feedback-based self-mixing sensor," Chin. Opt. Lett. 18, 011201 (2020)
Copy Citation Text
Self-mixing interferometry (SMI) is an attractive sensing scheme that typically relies on mono-modal operation of an employed laser diode. However, change in laser modality can occur due to change in operating conditions. So, detection of occurrence of multi-modality in SMI signals is necessary to avoid erroneous metric measurements. Typically, processing of multi-modal SMI signals is a difficult task due to the diverse and complex nature of such signals. However, the proposed techniques can significantly ease this task by identifying the modal state of SMI signals with 100% success rate so that interferometric fringes can be correctly interpreted for metric sensing applications.
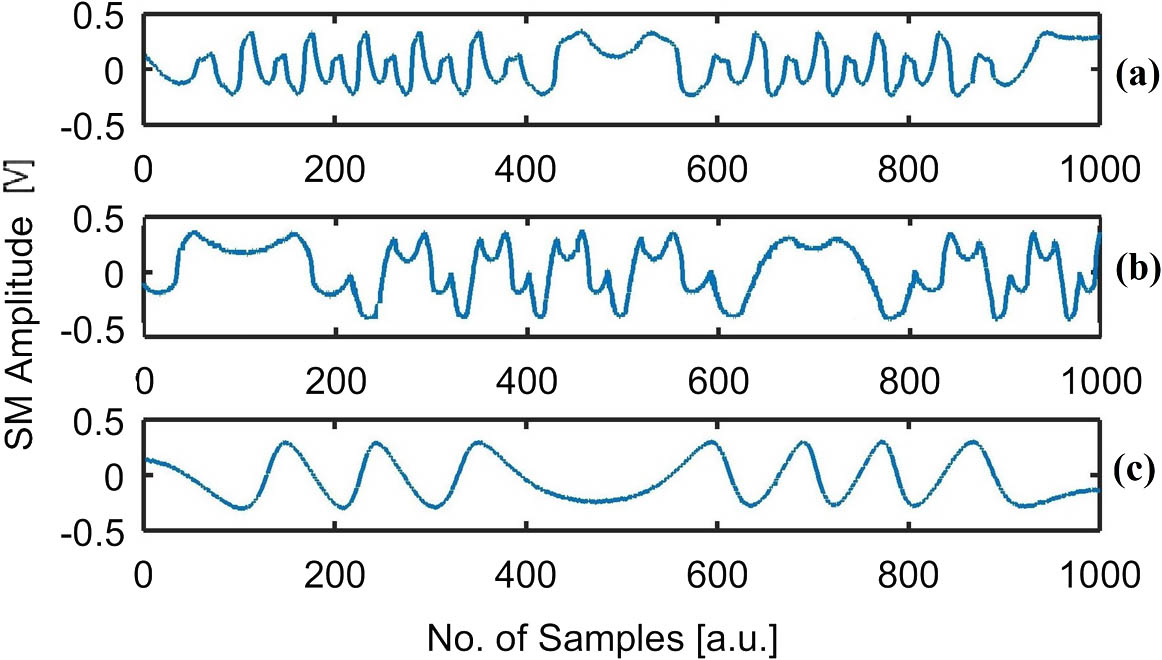
Self-mixing interferometry (SMI) or optical feedback (OF) interferometry[1,2] is actively researched for vibration, angle[3], frequency[4], size[5], range-finding[6], topography[7], and seismic applications[8] due to the simple, low-cost, and miniaturized nature of self-mixing (SM) sensors. In order to design low-cost SM sensors, usually commercial off the shelf (COTS) laser diodes (LDs) are preferred. However, due to OF inside the active laser cavity, such low-cost mono-modal LDs are prone to mode switching (as a function of operating conditions[9–11]), resulting in multi-modal SM signals in which more than one laser mode undergoes SM. As a consequence, each interferometric fringe can no more be assumed to correspond to a remote displacement of (where is the wavelength of the LD), because, in case of bi-modal or tri-modal SM, an individual SM fringe does not correspond to a displacement of anymore (see Fig. 1)[9]. Multi-modal SM has been used to potentially increase measurement resolution[10] as well as to measure free spectral range of the laser[12]. However, any unidentified switching of a mono-modal laser sensor to multi-modal operation can cause any unidentified severe measurement error due to incorrect fringe interpretation.
Figure 1.Experimental (a), (b) multi- and (c) mono-modal SM signals acquired under different OF coupling and operating current conditions based on the HL6501MG LD () with of (a), (c) 78 mA and (b) 82 mA.
The objective of this Letter is to robustly identify the occurrence of multi-modal SM signals so that an alert can be raised to appropriately interpret SM fringe count and/or SM operating conditions that can be changed (e.g., by changing the LD current[13] or amount of OF[14]) to revert back to mono-modal SM operation[12,15], for which algorithms exist yielding high accuracy measurements[16–20].
SM-based multi-modality is reported to occur due to variation in parameters such as LD-to-target distance[21,22], temperature[9], or LD current[10,13]. Measurement of laser emission spectra confirmed the existence of multiple laser modes undergoing an SM signal[9,13,23] for different laser sources such as Fabry–Perot LD[21], quantum cascade laser[23], and vertical-cavity surface-emitting laser (VCSEL)[10].
Sign up for Chinese Optics Letters TOC. Get the latest issue of Chinese Optics Letters delivered right to you!Sign up now
Recently, a method based on an artificial neural network was proposed to classify mono- and multi-modal SM signals with a success rate of 98.75%[24]. However, this neural-network-based approach requires hand-crafted feature engineering. Pertinent features (based on temporal and spatial characteristics of SM fringes) are extracted only after performing correct SM fringe detection, a task which is difficult to achieve for noisy, experimental SM signals even when only one mode undergoes SMI, as attested by the use of advanced detection methods based on Hilbert transform[25], customized wavelet transform[26], double-derivative[27] and signal envelope tracking[28], etc. However, in this Letter, the multi-modality of the SM signal is identified without using robust fringe detection by evaluating four different SM signal statistics under different noise, OF strength, amplitude of target vibration, and laser modality conditions. Use of majority vote among the four techniques has provided 100% identification success rate.
Various mono- and multi-modal SM signals were acquired by using two different LDs, L637P5 by Oclaro® and HL6501MG by Hitachi®, one at a time. A polished metallic ring (mounted on a mechanical shaker, SF-9324 by PASCO®) was used as the remote vibrating target. The L637P5 LD has an operating wavelength of 637 nm and threshold current of 20 mA, emitting 5 mW optical power. The HL6501MG LD has of 650 nm and of 45 mA, providing 35 mW optical power. Each LD has a built-in photodiode through which SM signals were obtained. Different mono- and multi-modal SM signals were acquired under varying OF and LD operating current () conditions. Multi-modal SM signals were observed to occur when both the OF coupling (by using the focusing lens) and (by using higher ) well exceeded unity. Figures 1(a) and 1(b) present two multi-modal SM signals based on the HL6501MG LD with an ratio of and , respectively, under high OF coupling. However, as OF coupling was reduced (by de-focusing the lens), then the mono-modal signal occurred even when was 1.73 [see Fig. 1(c)]. A dataset of 60 SM signals (30 mono- and 30 multi-modal SM signals) is used to verify the performance of the proposed techniques using SM signal statistical parameters.
Each of the proposed four different techniques for identification of SM multi-modality is detailed below.
The variance-based technique (VBT) is based on the parameter ‐, which is a measure of peak to peak dynamic variation of an SM signal. Clearly, ‐ should be generally greater for a multi-modal SM signal due to composition of different modes producing dissimilar multi-modal fringes, as opposed to a mono-modal signal in which similar fringes occur (see Fig. 1). Consequently, a larger variation in amplitude occurs in multi-modal signals as compared to mono-modal signals.
However, to perform VBT on normalized SM signals, two main phases are required: (1) customized local maxima detection and (2) estimation and analysis of ‐. Customized local maxima detection is done by the following steps, which are also presented in Fig. 2.First, inter-maxima separation () is computed by using auto-correlation of the SM signal. is indicative of the distance in between two consecutive maxima.Then, the mean value of the input SM signal, denoted by , is computed.The input SM signal (having and samples) is divided into ‘’ intervals by using .Then, the local maxima of each interval are determined.Valleys (SM signal portions with a lower amplitude around the local maxima) on the left () and right () are determined for each local maximum of every interval.Valley-less maxima are discarded, and maxima with both valleys are retained.Finally, amplitude values of maxima (having both valleys) are compared with , and maxima with greater amplitude values are retained and considered as genuine maxima, while those with lower amplitude values are removed.
Figure 2.Flowchart of customized maxima detection technique variations ().
VBT second phase steps (see Fig. 3) are detailed below.Differentiation of amplitude values of detected maxima () is taken to determine peak to peak dynamic. is determined by taking a variance of values.A threshold value () of is employed and compared with the value of the under-process SM signal to determine the modality of the input signal. If , then the input SM signal is considered a multi-modal signal, else it is considered a mono-modal signal. Note that this threshold (as well as subsequent thresholds in other techniques) is set in light of various simulation results obtained under varying OF coupling, amplitude of target vibration, and noise conditions as detailed ahead.
Figure 3.Flowchart of the variance-based technique (VBT).
The kurtosis-based technique (KBT) is based on the statistical parameter of kurtosis, which is indicative of a signal’s irregularity. Usually, the amplitude of multi-modal SM signals is more irregular as compared to that of mono-modal SM signals. Thus, the kurtosis value of an SM signal, denoted by , can be used to extract information about its modality, where
Here, denotes the standard deviation value of the input SM signal. A threshold value () is set (by using simulation results) and is compared with . If , then the input SM signal is considered multi-modal, else it is considered a mono-modal SM signal. Steps of KBT are shown in Fig. 4.
Figure 4.Steps of the kurtosis-based technique (KBT), skewness-based technique (SBT), and skewness–kurtosis-based technique (SKBT).
The skewness-based technique (SBT) uses the statistical parameter of skewness, which is a measure of asymmetry of the SM data around the sample mean. Conventionally, mono-modal SM signals are evenly distributed around the mean value. However, most commonly encountered multi-modal signals are not even around the mean value. Thus, the skewness parameter of an SM signal (denoted by ) can also be useful in classifying the modality of an SM signal:
Thus, is determined and is compared with the corresponding threshold value of the skewness parameter () to ascertain the modality of input SM signal. Steps of this technique are also shown in Fig. 4.
The skewness–kurtosis-based technique (SKBT) is based on the ratio () of the above-mentioned SM signal parameters. As both and detailed above are good indicators of multi-modality, their ratio () is also investigated for identifying multi-modality. [Note that to avoid division by values of approaching zero, all values of were set to 0.02 to plot in Fig. 5(d).] The absolute value of is compared with the employed threshold value (). If , then the under-process SM signal is considered multi-modal, else it is considered mono-modal. Steps of SKBT are also shown in Fig. 4.
Figure 5.Evolution of parameters with respect to and target vibration amplitude for noiseless mono-modal signal (a) , (b) , (c) , and (d) .
Let us now discuss how the various threshold values, used in each of the four presented techniques, were set by performing simulations for a representative sample of SM signals by using the SM model[12] under different OF coupling (such as the frequently encountered weak and moderate OF regime[1,2]), amplitude of target vibration in terms of , and additive noise [resulting in different signal to noise ratios (SNRs) of SM signals] conditions. Evolution of different parameters with respect to and amplitude of target vibration in the absence of noise for mono-modal operation can be observed from Fig. 5. It can be observed from Fig. 5(a) that is always lower than 0.017 for mono-modal noiseless SM signals. In Fig. 5(b), increases with , which is expected, since the more increases the more asymmetric the SM fringes become. Regarding [see Fig. 5(c)], for low values (close to one), is close to zero, as positive and negative fringes are similar. Then, as increases, the value tends to increase due to the increasing asymmetry between the positive and negative fringes of the SM signal.
Furthermore, to ascertain the impact of additive noise on the chosen parameters, simulations for the weak feedback regime () and moderate feedback regime () are also performed (see Tables 1 and 2, respectively). Two weak and moderate feedback regime SM signals under different noise conditions ( and ) are graphically shown in Fig. 6 as well. The value of is specifically chosen to perform noise analysis, as it generally corresponds to the worst-case statistical parameter values.
Figure 6.Simulated mono-modal SM signals with SNRs of 10 dB and 40 dB in the case of (a) weak feedback regime () and (b) moderate feedback regime ().
Table 1. Values of Statistical Parameters of Simulated Normalized Mono-Modal SM Signals for Varying SNR under Weak-Feedback Regime for C=0.1 and Amplitude of 5λ0
Table 2. Values of Statistical Parameters of Simulated Normalized Mono-Modal SM Signals for Varying SNRs under Moderate-Feedback Regime (C=4) and Amplitude of 5λ0
It can be observed from Table 1 and Fig. 6 that the value of parameters such as ‐ is decreasing significantly as SNR improves. Higher SNR values result in fewer local maxima generated by noise (and, thus, not genuine fringes) to be wrongly considered as fringe. Therefore, the calculation of ‐ will not take them into account, and, hence, the ‐ value will decrease.
Conducting these simulations under different levels of noise, amplitude of target vibration, and OF coupling provides information about the expected range and worst-case value of the proposed parameters, resulting in extraction of different threshold values (see Table 3).
VBT
KBT
SBT
SKBT
Features
varp‐diff
SMkur
SMskw
|SMskur|
Threshold values
0.017
2.7
0.2
5
Table 3. Extracted Threshold Values of Proposed Statistical Parameters Based on Simulations on Mono-Modal SM Signals under Varying Optical Feedback, Vibration Amplitude, and Signal to Noise Ratio
In order to determine the performance of the proposed techniques, the experimental dataset was tested to identify the modality of these SM signals by using the threshold values of Table 3. Results are presented in Table 4, where and indicate the number of tested mono- and multi-modal SM signals, respectively. Likewise, and indicate the number of truly identified mono- and multi-modal SM signals, respectively. Furthermore, and are the number of SM signals that are falsely identified as mono- and multi-modal SM signals, respectively. represents the total number of truly identified SM signals. In the last column, represents the overall success rate of the proposed techniques.
Techs.
Nmon/Nmul
Nmon-Ti
Nmul-Ti
Nmon-Fi
Nmul-Fi
Nto-Ti
Rs/%
VBT
30/30
30
21
9
0
51
85
KBT
30/30
24
21
9
6
45
75
SBT
30/30
29
26
4
1
55
91
SKBT
30/30
26
30
0
4
56
93
MV
30/30
30
30
0
0
100
100
Table 4. Performance of Proposed Techniques by Testing Experimentally Acquired Dataset of 60 SM Signals
An analysis of misidentified signals led to the observation that misidentification by the proposed techniques occurred for different SM signals. So, majority voting (MV) based on results of the four techniques was undertaken (for each tested signal), resulting in a 100% success rate. If a lower number of parameters are used for the sake of reducing the complexity of the blind identification, then if VBT is not used, while if only VBT and SBT are used, inclusive of MV in both cases. Some correctly identified mono- and multi-modal experimental SM signals are graphically presented in Figs. 7 and 8, respectively.
Figure 7.Correctly identified experimental mono-modal SM signals.
To conclude, an OF-based LD can provide a multi-modal SM signal in place of the usually encountered mono-modal SM signal because of mode-hopping caused by a change in operating conditions, such as LD-to-target distance. This can cause misinterpretation of the SM fringe count, resulting in a drastic increase in metric measurement error. To avoid this error, a continuous monitoring of the SM signal is necessary, so that, as the SM signal becomes multi-modal, it could be detected immediately and possibly reverted back to mono-modal behavior (e.g., by changing the LD current or OF strength). In this Letter, different techniques based on SM signal statistics are evaluated for future continuous monitoring of emission modality of low-cost LD-based SM sensors. These proposed techniques have been successfully tested on experimentally acquired mono- and multi-modal SM signals with success rates of 85% (VBT), 75% (KBT), 91% (SBT), and 93% (SKBT). Importantly, use of MV among the four proposed techniques has provided 100% success rate of SM modality identification.
Muhammad Usman, Usman Zabit, Olivier D. Bernal, Gulistan Raja, "Blind identification of occurrence of multi-modality in laser-feedback-based self-mixing sensor," Chin. Opt. Lett. 18, 011201 (2020)