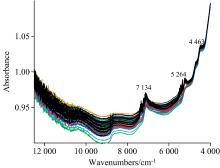
Fig. 1. Raw spectra of plum fruit
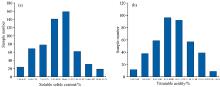
Fig. 2. The probability distribution of SSC (a) and TA (b) content for plum samples
Fig. 3. Quantitative results of PLS model for (a) SSC and (b) TA in plum samples
Fig. 4. Quantitative results of BP-ANN model for (a) SSC and (b) TA in plum samples
| 指标名称 | 波段/cm-1 | 校正集 | 交叉验证 | 因子数 | 剔除样品 |
|---|
| r | RMSEC | r | RMSECV |
|---|
| SSC/% | 4 000~9 000 | 0.890 1
0.891 1 | 1.01
1.01 | 0.876 3
0.877 5 | 1.06
1.06 | 8
8 | 剔除7个
剔除8个 | | 4 000~8 852 | 0.901 6
0.901 3
0.904 8 | 0.96
0.96
0.94 | 0.888 7
0.887 3
0.893 2 | 1.01
1.02
0.99 | 8
8
8 | 剔除7个
剔除8个
剔除10个 | | 4 000~8 000 | 0.886 2 | 1.03 | 0.871 8 | 1.08 | 8 | 剔除6个 | | 4 000~6 000 | 0.883 9
0.884 5 | 1.04
1.03 | 0.872 9
0.873 0 | 1.07
1.07 | 7
7 | 剔除7个
剔除8个 | | 6 000~9 000 | 0.888 5 | 1.02 | 0.872 8 | 1.08 | 7 | 剔除6个 | | TA/% | 4 000~9 000 | 0.821 2 | 0.89 | 0.811 4 | 0.90 | 6 | 剔除5个 | | 4 000~6 523 | 0.827 5 | 0.87 | 0.818 7 | 0.88 | 5 | 剔除5个 | | 4 605~9 000 | 0.822 3 | 0.88 | 0.812 2 | 0.90 | 6 | 剔除5个 | | 4 605~6 523 | 0.833 0 | 0.86 | 0.824 5 | 0.87 | 5 | 剔除5个 | | 5 605~9 000 | 0.824 8 | 0.88 | 0.812 3 | 0.90 | 6 | 剔除5个 | | 5 605~6 523 | 0.821 7 | 0.88 | 0.799 6 | 0.92 | 5 | 剔除6个 | | 6 410~7 600 | 0.818 5 | 0.89 | 0.810 2 | 0.90 | 5 | 剔除6个 |
|
Table 1. Comparison on performance of different model bands
| 指标名称 | 样品集 | 样品数 | 数值范围 | 平均值 | 标准偏差 |
|---|
SSC
/% | 校正集
预测集 | 382
191 | 5.20~16.00
5.40~14.90 | 10.16
10.19 | 2.23
2.14 | | TA/% | 校正集
预测集 | 267
130 | 6.15~13.45
6.44~12.68 | 9.88
9.84 | 1.55
1.52 |
|
Table 2. Statistics of SSC, TA in plum for calibration set and prediction set
| 光谱预处理 | 校正集 | 预测集 | 因子数 |
|---|
| Rc | RMSEC | Rp | RMSEP |
|---|
| 原始光谱 | 0.903 9 | 0.96 | 0.874 0 | 1.04 | 8 | | 消除常数偏移量 | 0.913 5 | 0.92 | 0.875 9 | 1.02 | 9 | | 减去一条直线 | 0.909 0 | 0.94 | 0.874 8 | 1.03 | 8 | | SNV | 0.911 4 | 0.93 | 0.874 0 | 1.04 | 8 | | 最大-最小归一化 | 0.903 4 | 0.97 | 0.863 3 | 1.08 | 8 | | MSC校正 | 0.914 4 | 0.91 | 0.878 5 | 1.00 | 8 | | 一阶微分+5点平滑 | 0.876 9 | 1.08 | 0.876 6 | 1.01 | 4 | | 一阶微分+17点平滑 | 0.844 0 | 1.20 | 0.833 0 | 1.18 | 4 | | 一阶微分+25点平滑 | 0.862 2 | 1.14 | 0.874 7 | 1.03 | 5 | | 二阶微分+17点平滑 | 0.869 8 | 1.11 | 0.795 5 | 1.29 | 4 | | 二阶微分+25点平滑 | 0.842 6 | 1.21 | 0.812 2 | 1.24 | 4 | 一阶微分+减去一条
直线+5点平滑 | 0.904 8 | 0.95 | 0.874 1 | 1.04 | 4 | | 一阶微分+SNV+25点平滑 | 0.905 2 | 0.95 | 0.876 0 | 1.02 | 8 | | 一阶微分+MSC+25点平滑 | 0.905 6 | 0.95 | 0.875 4 | 1.02 | 7 |
|
Table 3. Performance comparison with the SSC model of different spectral pretreatment methods
| 光谱预处理 | 校正集 | 预测集 | 因子数 |
|---|
| Rc | RMSEC | Rp | RMSEP |
|---|
| 原始光谱 | 0.840 3 | 0.85 | 0.807 2 | 0.89 | 5 | | 消除常数偏移量 | 0.795 2 | 0.95 | 0.794 8 | 0.92 | 4 | | 减去一条直线 | 0.830 6 | 0.87 | 0.796 3 | 0.92 | 5 | | SNV | 0.843 5 | 0.85 | 0.819 3 | 0.87 | 4 | | 最大-最小归一化 | 0.826 3 | 0.88 | 0.807 7 | 0.89 | 5 | | MSC校正 | 0.841 7 | 0.84 | 0.814 0 | 0.88 | 4 | | 一阶微分+17点平滑 | 0.841 0 | 0.84 | 0.813 9 | 0.88 | 4 | | 一阶微分+25点平滑 | 0.815 5 | 0.91 | 0.812 0 | 0.88 | 4 | | 二阶微分+17点平滑 | 0.841 2 | 0.84 | 0.760 8 | 0.98 | 4 | | 二阶微分+25点平滑 | 0.825 3 | 0.88 | 0.790 6 | 0.93 | 4 | 一阶微分+减去一条
直线+5点平滑 | 0.815 1 | 0.91 | 0.774 2 | 0.96 | 4 | | 一阶微分+SNV+9点平滑 | 0.860 3 | 0.80 | 0.819 6 | 0.86 | 6 | | 一阶微分+SNV+25点平滑 | 0.840 7 | 0.85 | 0.816 8 | 0.87 | 5 | | 一阶微分+MSC+25点平滑 | 0.809 2 | 0.92 | 0.775 3 | 0.95 | 4 |
|
Table 4. Performance comparison with the TA model of different spectral pretreatment methods
| 参数 | SSC | TA |
|---|
| 输入层函数 | tansig | tansig | | 隐含层函数 | logsig | logsig | | 输出层函数 | purelin | tansig | | 训练函数 | trainlm | traingdx | | 显示间隔 | 50 | 50 | | 学习速率 | 0.05 | 0.05 | | 训练目标 | 1×10⁻³ | 1×10⁻³ |
|
Table 5. Parameters of the BP-ANN models for SSC, TA in plums
| 隐含层节点数 | 校正集 | 预测集 |
|---|
| Rc | RMSEC | Rp | RMSEP |
|---|
| 10 | 0.935 1 | 0.84 | 0.719 3 | 1.15 | | 11 | 0.945 1 | 0.82 | 0.671 2 | 1.25 | | 12 | 0.925 4 | 0.85 | 0.660 2 | 1.29 | | 13 | 0.950 8 | 0.81 | 0.755 3 | 1.15 | | 14 | 0.955 7 | 0.81 | 0.782 0 | 1.04 | | 15 | 0.960 4 | 0.80 | 0.797 9 | 1.04 | | 16 | 0.964 1 | 0.79 | 0.854 0 | 1.02 | | 17 | 0.964 3 | 0.79 | 0.871 9 | 1.01 | | 18 | 0.976 7 | 0.75 | 0.889 7 | 0.99 | | 19 | 0.967 2 | 0.78 | 0.713 2 | 1.16 | | 20 | 0.965 9 | 0.78 | 0.675 9 | 1.22 |
|
Table 6. Influence of nodes in hidden layer on quantitative results of SSC in plum
| 隐含层节点数 | 校正集 | 预测集 |
|---|
| Rc | RMSEC | Rp | RMSEP |
|---|
| 10 | 0.941 0 | 0.66 | 0.806 4 | 0.88 | | 11 | 0.947 9 | 0.65 | 0.787 7 | 0.91 | | 12 | 0.959 1 | 0.64 | 0.817 7 | 0.86 | | 13 | 0.958 4 | 0.64 | 0.800 6 | 0.91 | | 14 | 0.962 1 | 0.63 | 0.806 0 | 0.87 | | 15 | 0.956 7 | 0.64 | 0.830 7 | 0.85 | | 16 | 0.955 2 | 0.64 | 0.795 4 | 0.91 | | 17 | 0.956 7 | 0.64 | 0.806 2 | 0.87 | | 18 | 0.960 8 | 0.63 | 0.877 3 | 0.84 | | 19 | 0.974 3 | 0.62 | 0.897 7 | 0.83 | | 20 | 0.968 4 | 0.63 | 0.867 6 | 0.84 |
|
Table 7. Influence of nodes in hidden layer on quantitative results of TA in plum
| 检测指标 | 建模方法 | 校正集 | 预测集 |
|---|
| Rc | RMSEC | Rp | RMSEP |
|---|
| SSC/% | PLS
BP-ANN | 0.914 4
0.976 7 | 0.91
0.75 | 0.878 5
0.889 7 | 1.00
0.99 | | TA/% | PLS
BP-ANN | 0.860 3
0.974 3 | 0.80
0.62 | 0.819 6
0.897 7 | 0.86
0.83 |
|
Table 8. Quantitative results of the established models using PLS and BP-ANN methods for SSC, TA in plum