• Laser & Optoelectronics Progress
  • Vol. 59, Issue 12, 1215008 (2022)
Qing Yang1, Yuqian Zhao1、2、*, Fan Zhang1, and Miao Liao1
Author Affiliations
  • 1School of Automation, Central South University, Changsha 410083, Hunan , China
  • 2Hunan Engineering and Technology Research Center of High Strength Fastener Intelligent Manufacturing, Changde 415701, Hunan , China
  • show less
    DOI: 10.3788/LOP202259.1215008 Cite this Article Set citation alerts
    Qing Yang, Yuqian Zhao, Fan Zhang, Miao Liao. Automatic Segmentation of Defect in High-Precision and Small-Field TFT-LCD Images[J]. Laser & Optoelectronics Progress, 2022, 59(12): 1215008 Copy Citation Text show less
    Images of subpixel. (a) (b) Origin image; (c) (e) partial enlarged image of defect; (d) (f) partial enlarged image of normal area
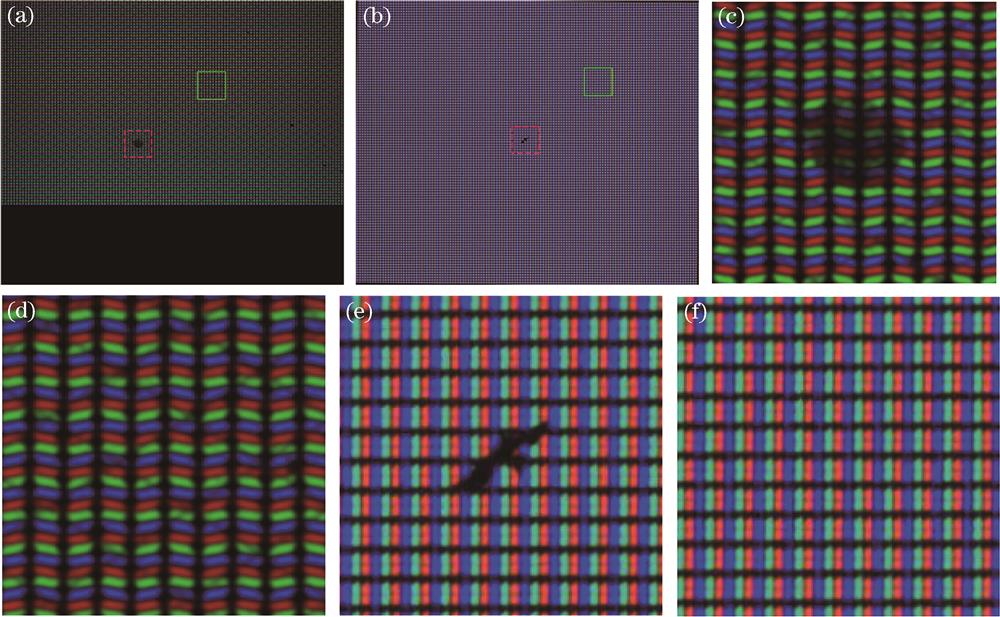
    Fig. 1. Images of subpixel. (a) (b) Origin image; (c) (e) partial enlarged image of defect; (d) (f) partial enlarged image of normal area
    Images of significance detection’s spatial information. (a) Single scale; (b) multiple scales
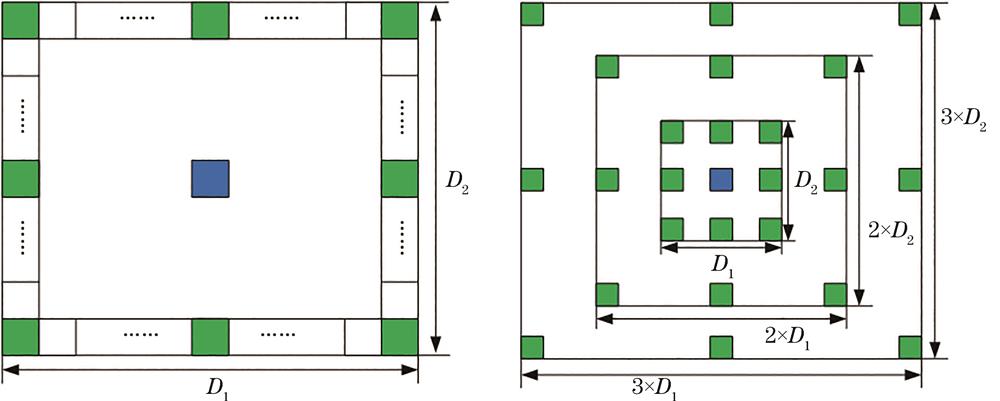
    Fig. 2. Images of significance detection’s spatial information. (a) Single scale; (b) multiple scales
    Saliency detection results of small size defect at different scales. (a) Origin image; (b) image with scale 1; (c) image with scale 2; (d) image with scale 3
    Fig. 3. Saliency detection results of small size defect at different scales. (a) Origin image; (b) image with scale 1; (c) image with scale 2; (d) image with scale 3
    Saliency detection results of large size defect. (a) Origin image; (b) image with scale 1; (c) image with scale 2; (d) image with scale 3; (e) 2-scale fusion; (f) 3-scale fusion
    Fig. 4. Saliency detection results of large size defect. (a) Origin image; (b) image with scale 1; (c) image with scale 2; (d) image with scale 3; (e) 2-scale fusion; (f) 3-scale fusion
    Result of defect region binarization. (a) Origin image; (b) multiscale saliency detection; (c) binarization; (d) interference cancellation
    Fig. 5. Result of defect region binarization. (a) Origin image; (b) multiscale saliency detection; (c) binarization; (d) interference cancellation
    Illustration of complete defect area acquisition process. (a) Binarization; (b) image of defect and gaps; (c) convex hull fitting; (d) final result
    Fig. 6. Illustration of complete defect area acquisition process. (a) Binarization; (b) image of defect and gaps; (c) convex hull fitting; (d) final result
    Illustration of defect block grouping. (a) Origin image; (b) image of defect and gaps; (c) equality of both sides; (d) inequality of both sides
    Fig. 7. Illustration of defect block grouping. (a) Origin image; (b) image of defect and gaps; (c) equality of both sides; (d) inequality of both sides
    Illustration of defect block connection. (a) Local convex hull fitting; (b) final result
    Fig. 8. Illustration of defect block connection. (a) Local convex hull fitting; (b) final result
    Comparison of segmentation results by different methods. (a) Origin image; (b) manual segmentation; (c) proposed method; (d) contrast experiment 1; (e) contrast experiment 2
    Fig. 9. Comparison of segmentation results by different methods. (a) Origin image; (b) manual segmentation; (c) proposed method; (d) contrast experiment 1; (e) contrast experiment 2
    MethodPrecision /%Recall /%
    Proposed method95.3693.34
    Contrast experiment 190.9478.89
    Contrast experiment 286.6497.43
    Table 1. Performance comparison of segmentation results for 600 defect images
    MethodNumber of correct defectsNumber of error defectsAccuracy /%
    Proposed method5792196.5
    Contrast experiment 147712379.5
    Contrast experiment 25475391.17
    Table 2. Comparison of the defect size calculation results for 600 defect images obtained by proposed method and microrule
    Qing Yang, Yuqian Zhao, Fan Zhang, Miao Liao. Automatic Segmentation of Defect in High-Precision and Small-Field TFT-LCD Images[J]. Laser & Optoelectronics Progress, 2022, 59(12): 1215008
    Download Citation