• Laser & Optoelectronics Progress
  • Vol. 59, Issue 17, 1714004 (2022)
Shaodong Song1, Yanyan Wang1、*, Linsen Shu1、2, and Yajuan He1
Author Affiliations
  • 1College of Mechanical Engineering, Shaanxi University of Technology, Hanzhong 723001, Shaanxi , China
  • 2Shaanxi Key Laboratory of Industrial Automation, Hanzhong 723001, Shaanxi , China
  • show less
    DOI: 10.3788/LOP202259.1714004 Cite this Article Set citation alerts
    Shaodong Song, Yanyan Wang, Linsen Shu, Yajuan He. Optimization of 6061 Aluminum Alloy Laser Welding Process Based on RSM-PSO[J]. Laser & Optoelectronics Progress, 2022, 59(17): 1714004 Copy Citation Text show less
    Laser welding system
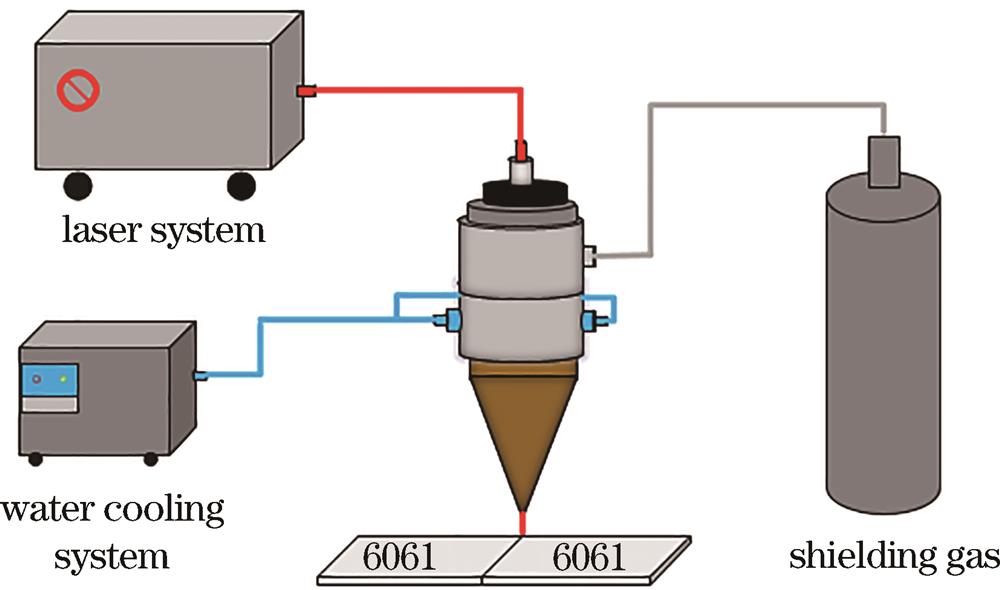
    Fig. 1. Laser welding system
    Diagram of deformation measurement
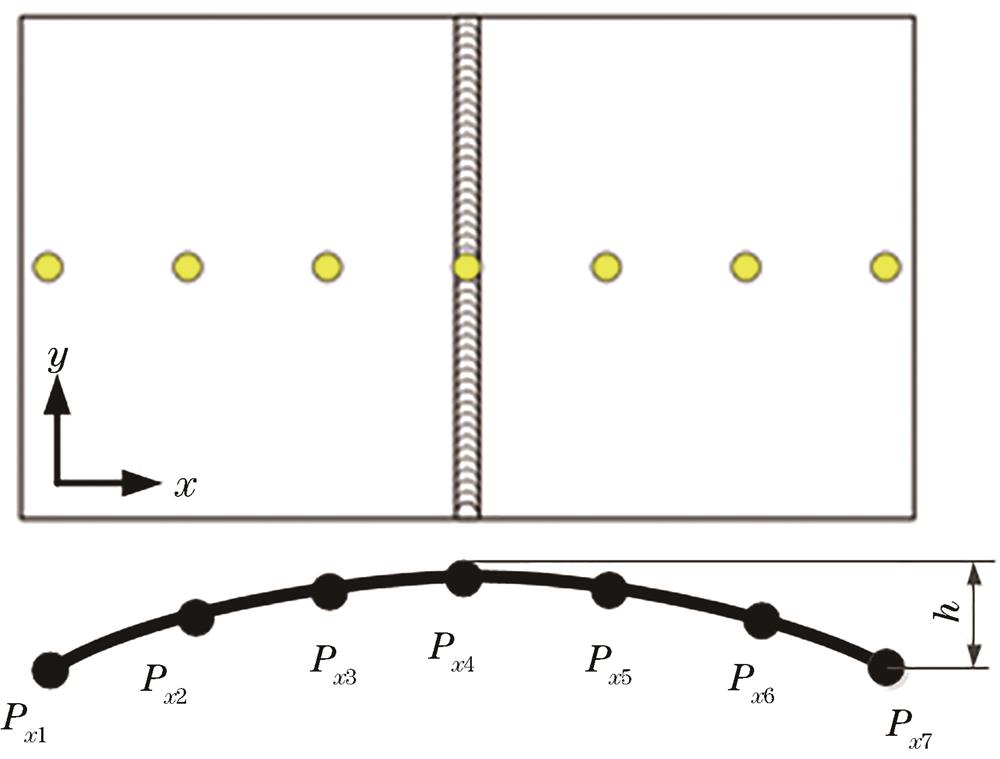
    Fig. 2. Diagram of deformation measurement
    RSM-PSO optimization flow chart
    Fig. 3. RSM-PSO optimization flow chart
    Normal probability residuals of the model. (a) Collapse model; (b) bending deformation model
    Fig. 4. Normal probability residuals of the model. (a) Collapse model; (b) bending deformation model
    Weld section diagram
    Fig. 5. Weld section diagram
    Response value is the functional perturbation trend graph of the deviation of the central reference point. (a) Collapse depth; (b) bending deformation
    Fig. 6. Response value is the functional perturbation trend graph of the deviation of the central reference point. (a) Collapse depth; (b) bending deformation
    Interaction of process parameters on collapse depth. (a) Scanning speed and defocusing amount; (b) defocusing amount and laser power
    Fig. 7. Interaction of process parameters on collapse depth. (a) Scanning speed and defocusing amount; (b) defocusing amount and laser power
    Interaction of process parameters on bending deformation. (a) Laser power and scanning speed; (b) laser power and defocusing amount
    Fig. 8. Interaction of process parameters on bending deformation. (a) Laser power and scanning speed; (b) laser power and defocusing amount
    Fitness curve
    Fig. 9. Fitness curve
    Joint section views. (a) Optimal sample; (b) S9 sample; (c) S10 sample
    Fig. 10. Joint section views. (a) Optimal sample; (b) S9 sample; (c) S10 sample
    No.P /WV /(mm·s-1f /mmBending deformation /mmCollapse depth /μm
    S125805-0.21.0642.00
    S226407-0.22.8548.75
    S32580701.4578.56
    S426407-0.23.1610.83
    S525809-0.22.1554.36
    S626407-0.22.4568.39
    S726407-0.22.8590.45
    S826409-0.42.2652.84
    S92640502.0660.23
    S1026407-0.23.4600.48
    S1127009-0.23.1356.25
    S1227007-0.42.1493.13
    S132640903.389.63
    S1427005-0.21.8634.12
    S1525807-0.42.2557.13
    S162700703.8221.04
    S1726405-0.42.0243.52
    Table 1. Experimental design and response
    ModelSum of squaresMean squareF valueValue of P > FLack of fitR-squared
    Collapse depth4.58×10557245.9617.470.0003(significant)0.0879(not significant)0.9459
    Bending deformation8.240.929.190.0041(significant)0.5896(not significant)0.9221
    Table 2. Model analysis of variance table
    Shaodong Song, Yanyan Wang, Linsen Shu, Yajuan He. Optimization of 6061 Aluminum Alloy Laser Welding Process Based on RSM-PSO[J]. Laser & Optoelectronics Progress, 2022, 59(17): 1714004
    Download Citation