
Chengbin Xing, Xingsheng Deng, Kang Xu. Contour Determination Method for Threshold of Morphological Filtering Key Parameters[J]. Laser & Optoelectronics Progress, 2019, 56(16): 162802
- Laser & Optoelectronics Progress
- Vol. 56, Issue 16, 162802 (2019)
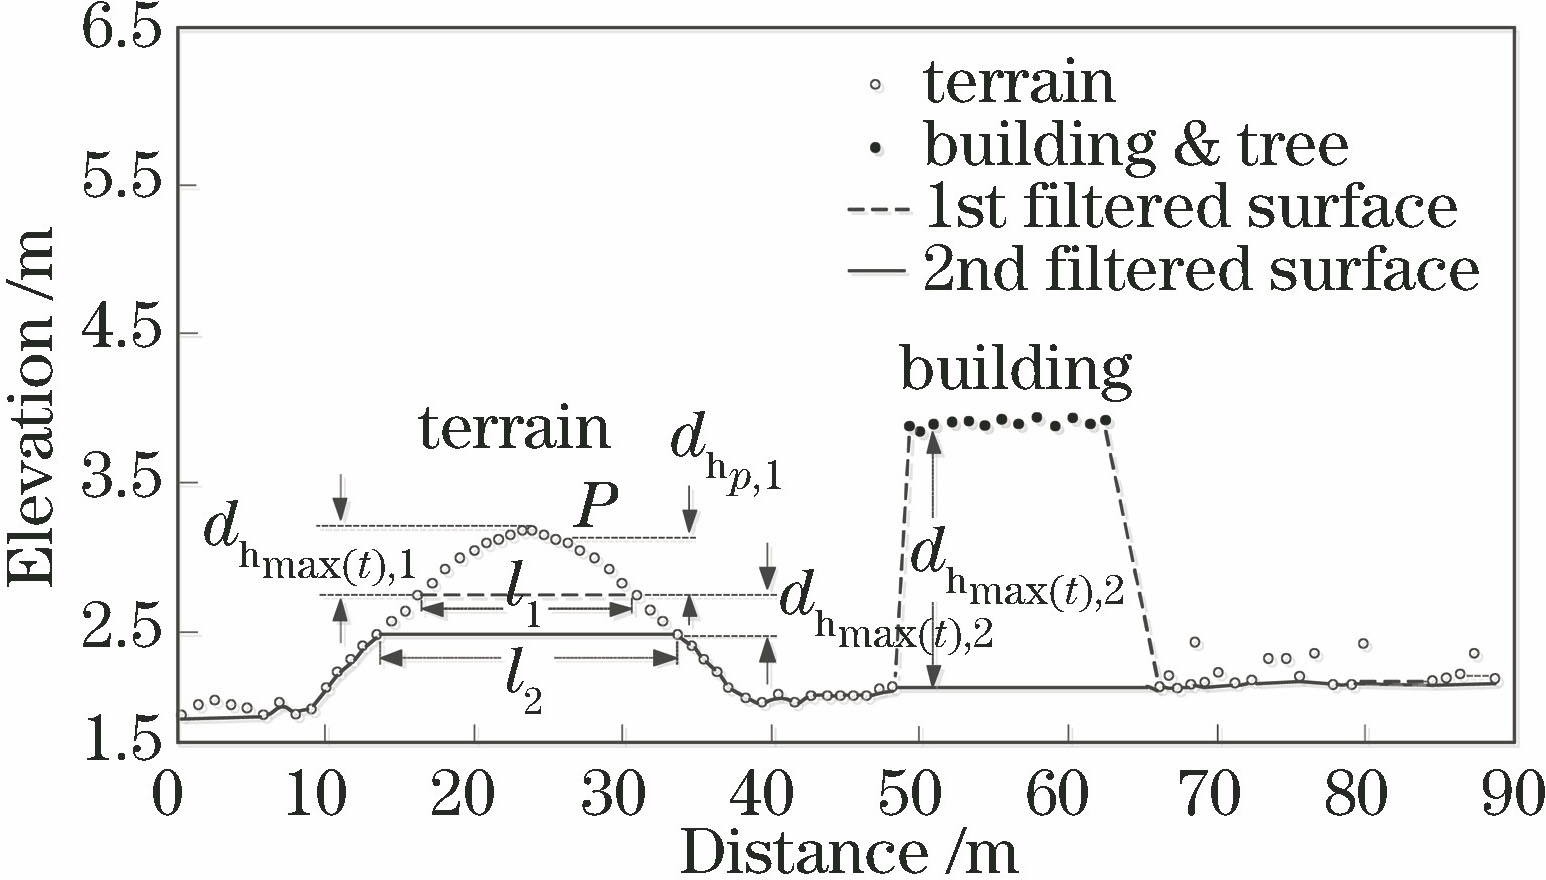
Fig. 1. Progressive filtering algorithm implementation process
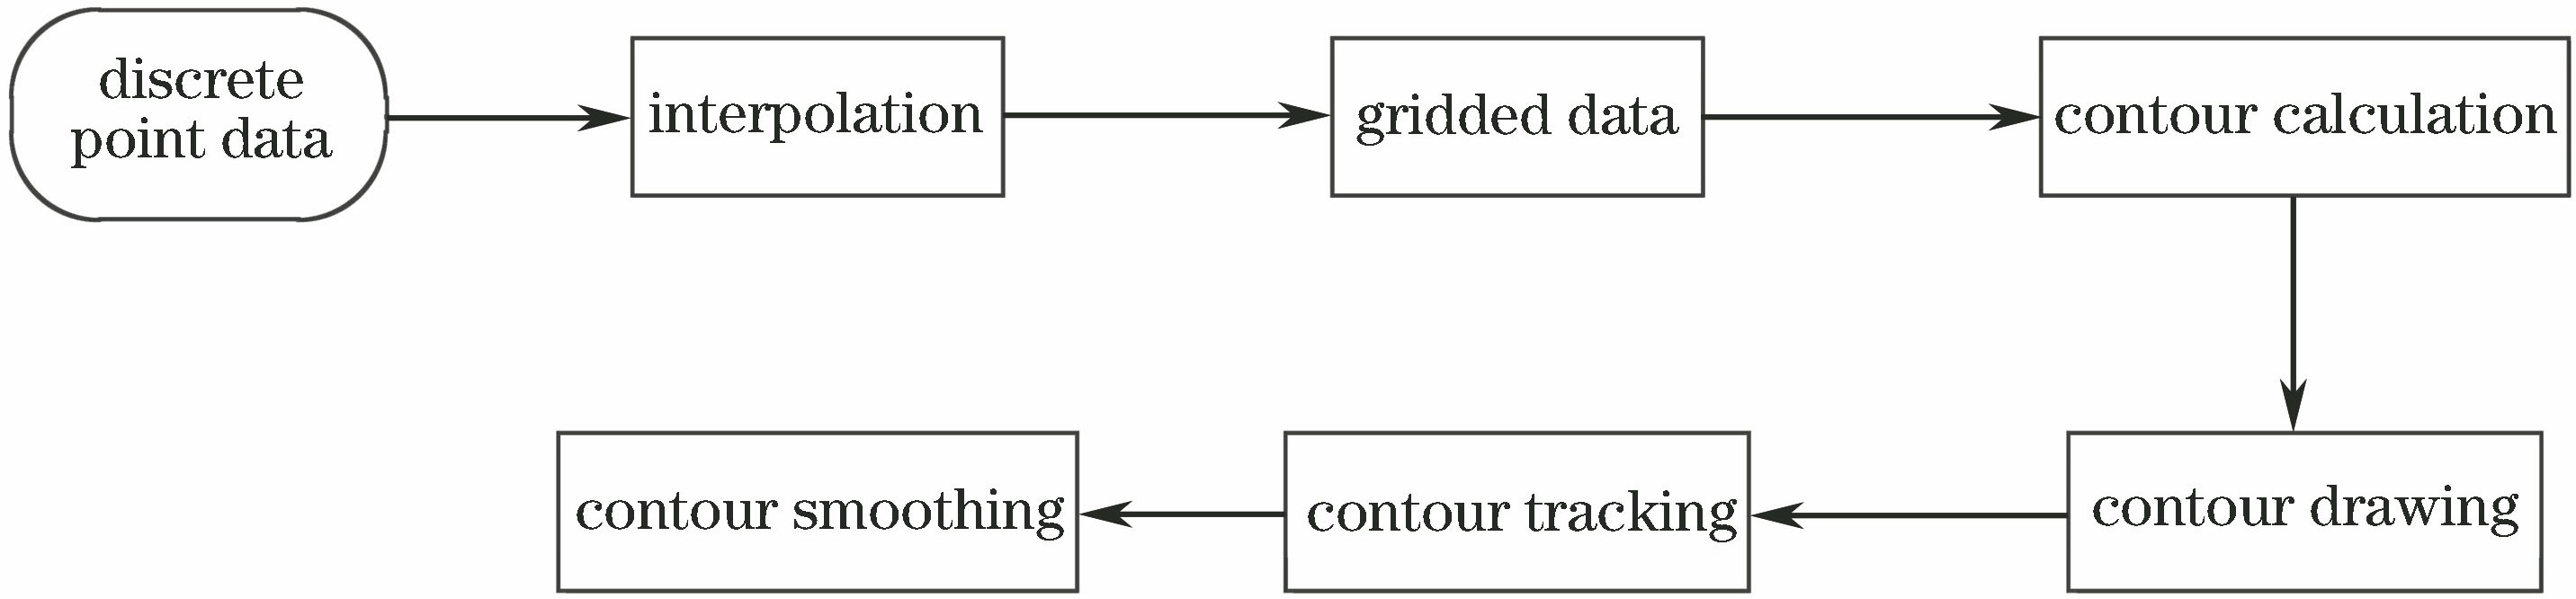
Fig. 2. Contour generation flow chart
Fig. 3. Aerial photography of the survey area
Fig. 4. Contour to determine the shape of the stadium
Fig. 5. Point cloud contour filling distribution in the building area
Fig. 6. LiDAR point cloud distribution in the building area
Fig. 7. Tilt angle to determine the same height difference
Fig. 8. Isometric line-morphological filtering algorithm flow chart
Fig. 9. Contour determination window threshold
Fig. 10. Distribution of point cloud
Fig. 11. Samp23 survey area before and after filtering. (a) Before filtering; (b) after filtering
Fig. 12. Filtering accuracy of different height difference thresholds (window threshold is 30 m)
Fig. 13. Filtering accuracy of different window thresholds (height difference threshold is 20 m)
Fig. 14. Filtering results of different algorithms in the FSite8_red2 survey area. (a) TIN algorithm; (b) morphology algorithm
|
Table 1. Number of point cloud points in Samp23 survey area and two types of error statistics
|
Table 2. Two algorithms in Samp41 data point ground point, feature point, type I error, and type II error

Set citation alerts for the article
Please enter your email address
© Copyright 2018-2021 | Chinese Laser Press. All Rights Reserved 沪ICP备15018463号-20