
Zixiang Yan, Hao Liu, Xinyu Zhang, Guoli Ren, Jie Liu, Wei Kang, Weiyan Zhang, Xiantu He. Dynamics of particles near the surface of a medium under ultra-strong shocks[J]. Matter and Radiation at Extremes, 2021, 6(2): 026903
- Matter and Radiation at Extremes
- Vol. 6, Issue 2, 026903 (2021)
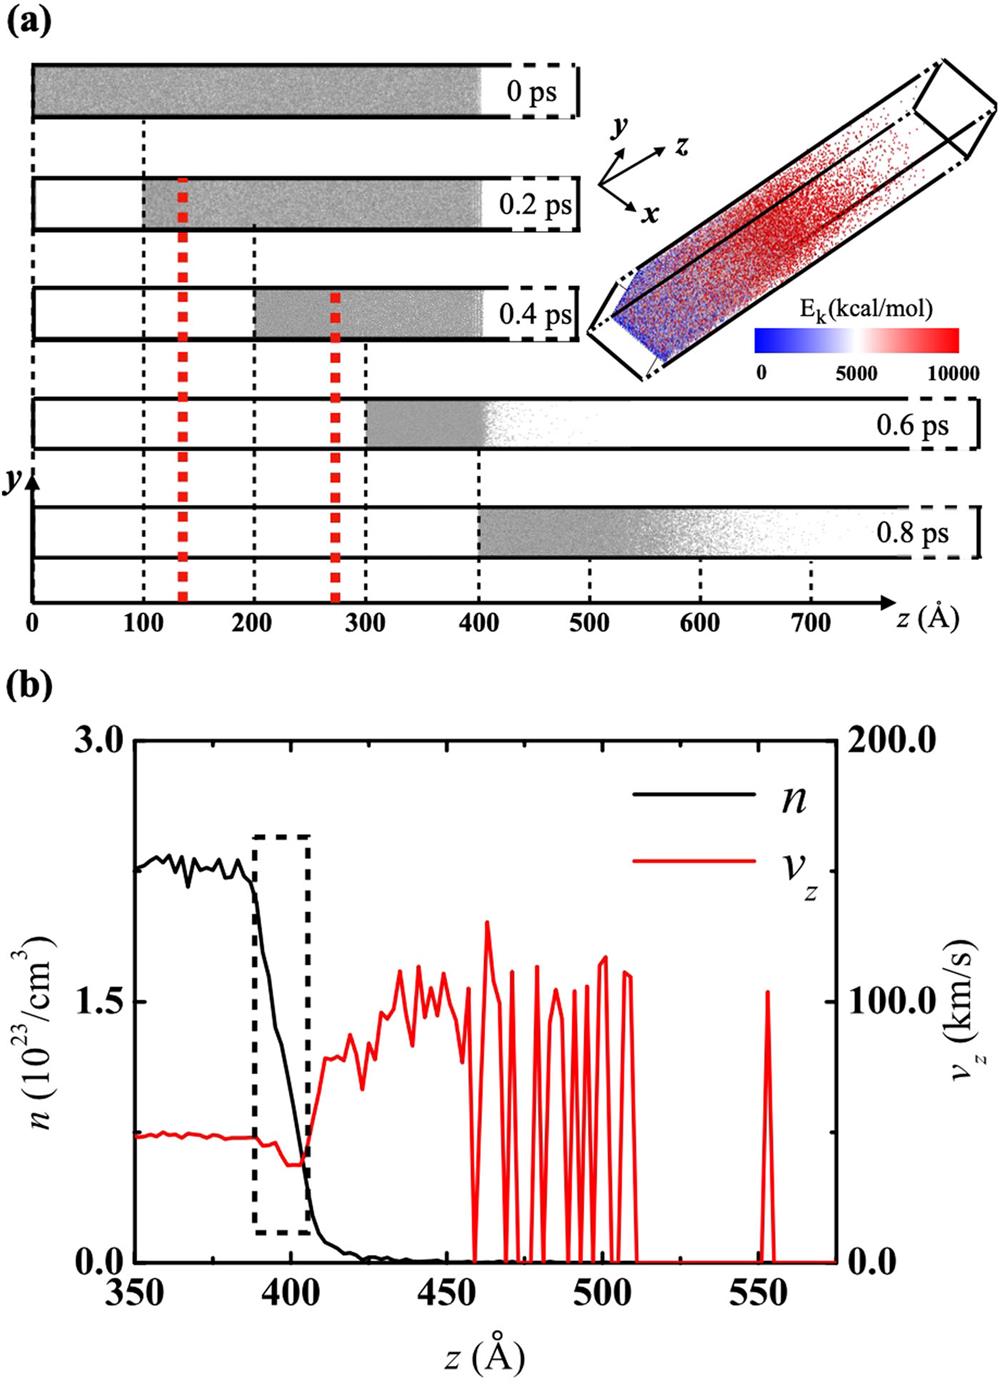
Fig. 1. (a) Setup of the NEMD simulations, where a shock wave propagates along the z axis. The red dashed lines indicate the positions of the shock front at 0.2 ps and 0.4 ps. The shock front emerges from the initial free surface (z = 400 Å) at about 0.6 ps. The three-dimensional structure of the medium at 0.8 ps is illustrated in the inset, where the red particles represent those containing higher kinetic energy E k and the blue particles those with lower E k . (b) Distributions of density and velocity for 4X atoms along the z axis at t = 0.6 ps. The corresponding piston speed is v p = 50 km/s.
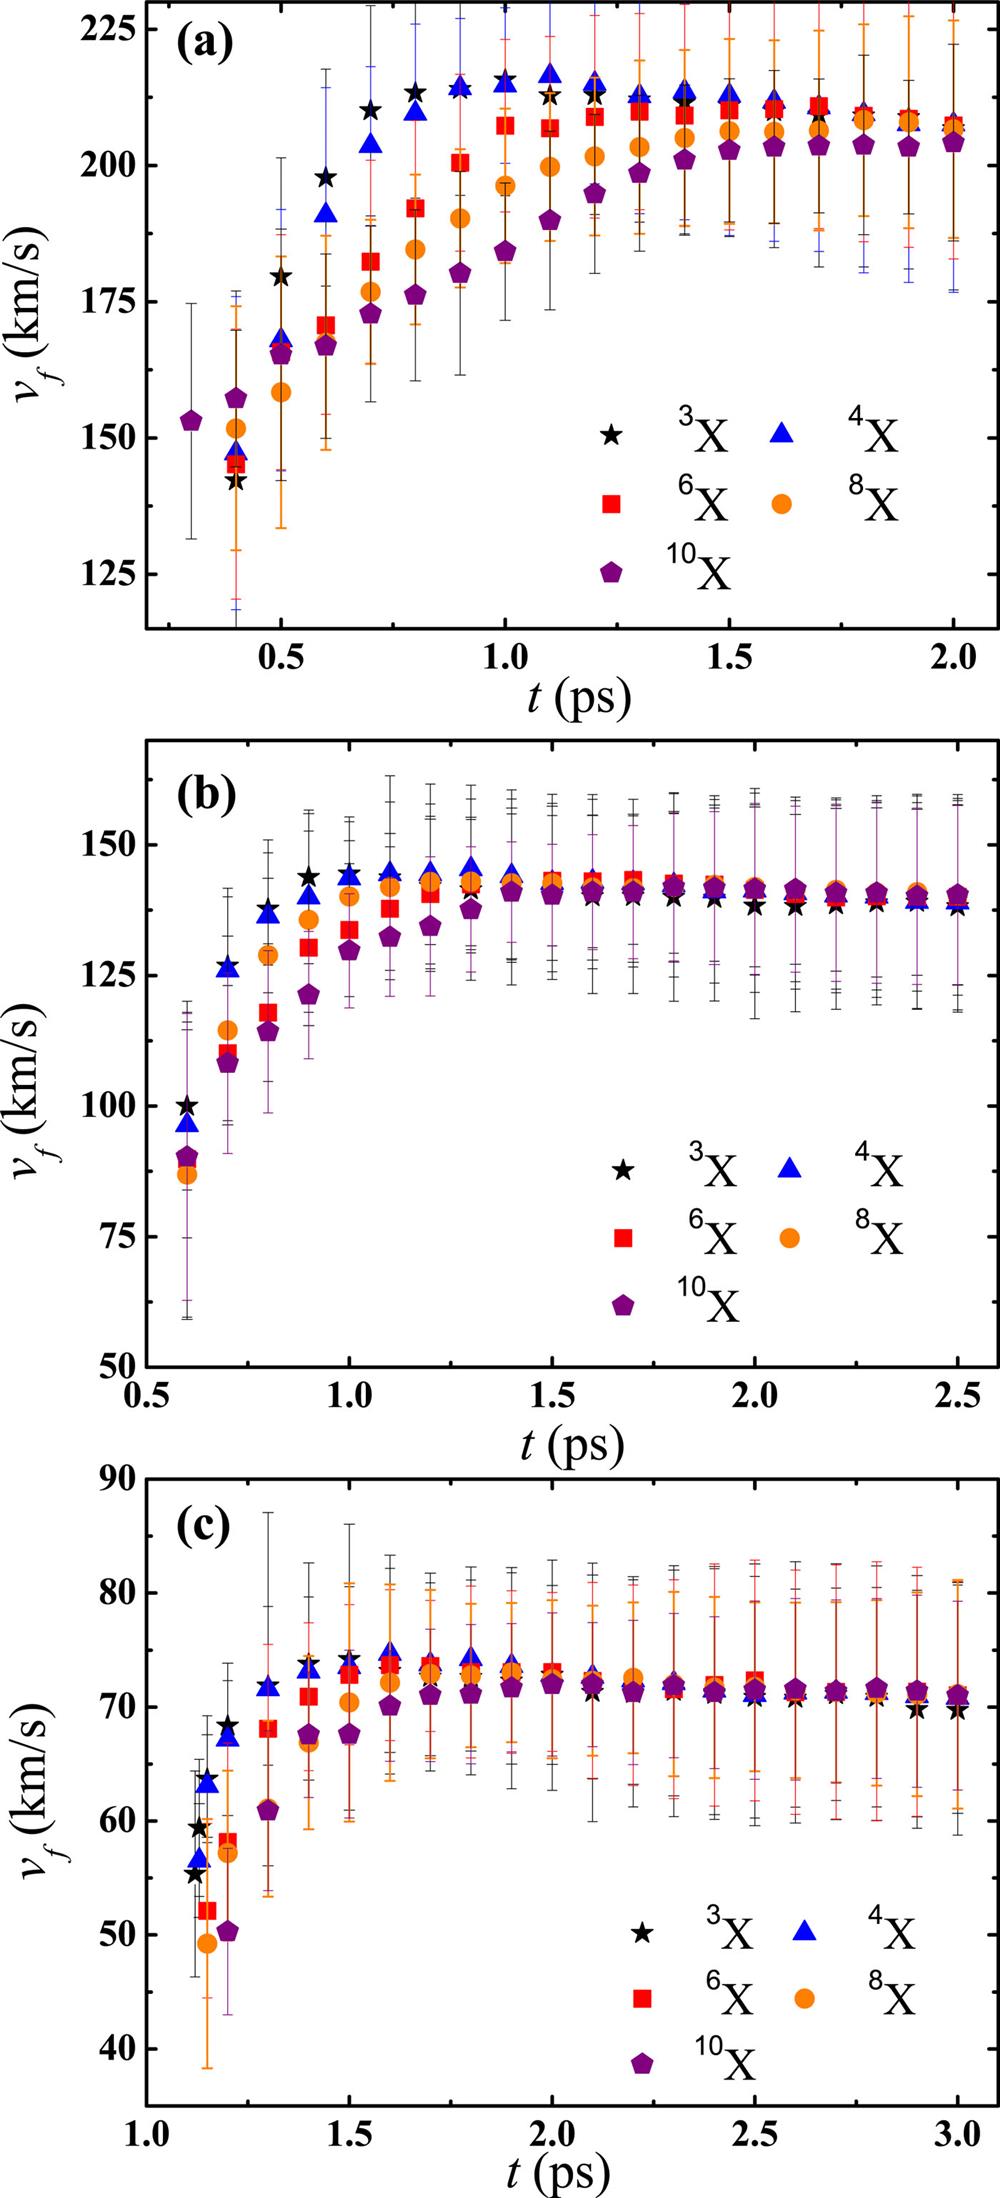
Fig. 2. Effects of atomic mass m X and piston speed v p on the velocity of the reflecting surface, v f . The reflecting surface is near n c = 2.348 × 1021 cm−3, and the piston speed is (a) v p = 75.0 km/s, (b) v p = 50.0 km/s, or (c) v p = 25.0 km/s.
Fig. 3. Effect of critical number density n c on v f . Two isotopes of X, namely, 4X and 8X, are taken as examples.
Fig. 4. Distributions of thermal and virial pressures at (a) t = 0.6 ps and (b) t = 2.0 ps. The areas between the black vertical dashed lines and between the orange vertical dashed lines represent the ranges of the reflecting surfaces of the 4X and 8X media, respectively. The critical number density determining the reflecting surface is n c = 2.348 × 1021 cm−3 for both media.
Fig. 5. Comparison of the distributions of number density and velocity. (a) and (b) show the number density and velocity, respectively, in the z direction at t = 0.8 ps, while (c) and (d) show those at t = 2.0 ps. The areas between the black vertical dashed lines and between the orange vertical dashed lines represent the ranges of the reflecting surfaces of the 4X and 8X media, respectively. The critical number density determining the reflecting surface is n c = 2.348 × 1021 cm−3 for both media.
Fig. 6. Scaling law of v f . The blue dashed line represents the best-fitting curve, and the scattered dots are the simulation results for various piston speeds and atomic masses, as shown in the key.
|
Table 1. Best fitting parameters for the scaling law of vf.

Set citation alerts for the article
Please enter your email address
© Copyright 2018-2021 | Chinese Laser Press. All Rights Reserved 沪ICP备15018463号-20