• Matter and Radiation at Extremes
  • Vol. 6, Issue 2, 026903 (2021)
Zixiang Yan1, Hao Liu2, Xinyu Zhang3, Guoli Ren4, Jie Liu3、5, Wei Kang3、a), Weiyan Zhang3、6, and Xiantu He3、4
Author Affiliations
  • 1HEDPS, Center for Applied Physics and Technology, and School of Physics, Peking University, Beijing 100871, China
  • 2Department of Applied Physics, School of Physics and Electronics, Hunan University, Changsha 410082, China
  • 3HEDPS, Center for Applied Physics and Technology, and College of Engineering, Peking University, Beijing 100871, China
  • 4Institute of Applied Physics and Computational Mathematics, Beijing 100088, China
  • 5Graduate School, China Academy of Engineering Physics, Beijing 100193, China
  • 6China Academy of Engineering Physics, Mianyang 621900, China
  • show less
    DOI: 10.1063/5.0030906 Cite this Article
    Zixiang Yan, Hao Liu, Xinyu Zhang, Guoli Ren, Jie Liu, Wei Kang, Weiyan Zhang, Xiantu He. Dynamics of particles near the surface of a medium under ultra-strong shocks[J]. Matter and Radiation at Extremes, 2021, 6(2): 026903 Copy Citation Text show less

    Abstract

    Through nonequilibrium molecular dynamics simulations, we provide an atomic-scale picture of the dynamics of particles near the surface of a medium under ultra-strong shocks. This shows that the measured surface velocity vf under ultra-strong shocks is actually the velocity of the critical surface at which the incident probe light is reflected, and vf has a single-peaked structure. The doubling rule commonly used in the case of relatively weak shocks to determine particle velocity behind the shock front is generally not valid under ultra-strong shocks. After a short period of acceleration, vf exhibits a long slowly decaying tail, which is not sensitive to the atomic mass of the medium. A scaling law for vf is also proposed, and this may be used to improve the measurement of particle velocity u in future experiments.

    I. INTRODUCTION

    In recent years, with the advent of high-power lasers, laser-driven shocks have become widely used to determine equations of state (EOS) for various materials1–13 of fundamental interest to inertial confinement fusion (ICF).14–19 According to the Rankine–Hugoniot relations, the determination of all the flow variables of a shock front in such experiments can be reduced to the determination of two kinematic parameters, namely, the propagation speed vs of the shock wave and the average particle velocity u behind the shock front.20 Although vs can be measured with relative ease, determining u is more difficult experimentally. One commonly used indirect method is the so-called free-surface approximation,20 which assumes that the velocity of the free surface is twice the average particle velocity, i.e., vf = 2u, which is also known as the doubling rule. It has been shown both theoretically20 and experimentally21–25 that this approximation works well at relatively low Mach number. However, the way in which vf departs from this rule under strong shocks remains an open question. Better understanding of this question is of great interest to laser-driven EOS experiments, in which ultra-strong shocks are often generated.

    The most frequently used technique for measuring the velocities of free surfaces and interfaces is the velocity interferometer system for any reflector (VISAR), which has been improved26–30 and applied in many experiments.31–35 An important mechanism underlying the use of this system is the reflection of the detecting laser from a moving surface. However, since a perfect two-dimensional surface does not exist in reality, the positions where the light is reflected and what the device really measures are still a matter of debate.36 A clear understanding of the detailed structure and dynamical evolution of particles in the vicinity of the shock front can help provide answers to these questions.

    Our study focuses on the free-surface velocity vf under ultra-strong shocks. With nonequilibrium molecular dynamics (NEMD) simulation methods, we find that the free surface no longer exists under ultra-strong shocks. It is replaced by a transient regime of expanding plasma, and vf is actually the velocity of the critical surface of the reflected detecting laser light. The evolution of vf exhibits a single-peaked structure as time passes by. vf only approximately agrees with the doubling rule in a short transient period immediately after the shock breaks out. This is then followed by a short acceleration process to reach its maximum. After that, vf slowly decays with the expansion of the material. During the decay process, vf gradually converges to a value that depends on the wavelength of the detecting laser, but is independent of the atomic mass (or density) of the medium.

    Simulation results further show that this trend of vf is the result of two competing mechanisms. One is the hydrodynamic acceleration provided by the pressure gradient. The other is the backward shift of the reflecting surface caused by the decreasing density of particles during the expansion of the transient plasma surface. It is also found that the dynamical behavior of vf can be described by a scaling law, which may be used to improve the measurement of u in laser-driven EOS experiments.

    The rest of this article is organized as follows. Details of the NEMD simulations are presented in Sec. II. The main results and corresponding analyses are presented in Sec. III. A short summary is given in Sec. IV.

    II. SIMULATION METHOD

    In this work, the NEMD method37 is employed to study the structure and dynamical process near the surface of a medium surface under ultra-strong shocks. This method removes the limitation imposed by the assumption of local thermal equilibrium (LTE),38 making it suitable for studies of ultra-strong shock compression in dense materials. In addition, molecular dynamics (MD) simulations can directly provide microscopic information about the structure of shock waves, which may not be accessed by hydrodynamical calculations or other methods.

    F(x̃)=expDx̃12for x̃<D,1for x̃D.The parameters are rm = 2.9673 Å, ϵ/kB = 10.8 K, A = 0.544 850 4 × 10⁶, β = 13.353 384, C6 = 1.373 241 2, C8 = 0.425 378 5, C10 = 0.178 100, and D = 1.241 314.

    The dimensions of the simulation box are 50 × 50 × 3000 Å3. As displayed schematically in Fig. 1(a), 62 800 X atoms are assembled in the left 400 Å of this box. A moving reflective boundary is used as a piston to generate a shock wave propagating along the long side of the box, denoted as the z axis. The piston is placed at z = 0 at t = 0 and then moves at a constant velocity vp = 75 km/s, 50 km/s, or 25 km/s. Along the two perpendicular axes, denoted as the x and y axes, periodic boundaries are used to prevent finite-size effects of boundary reflections. In addition, the simulation box is divided into slices of 2 Å thickness along the z axis to calculate the statistics of macroscopic observables and thermodynamic variables. Details of the simulation can also be found in our previous work.38 To reveal the effect of relative atomic mass mX (also the effect of density) on vf, we carry out the simulation with several isotopes of X, such as 3X, 4X, 6X, 8X, and 10X, but keep the initial number density unchanged.

    (a) Setup of the NEMD simulations, where a shock wave propagates along the z axis. The red dashed lines indicate the positions of the shock front at 0.2 ps and 0.4 ps. The shock front emerges from the initial free surface (z = 400 Å) at about 0.6 ps. The three-dimensional structure of the medium at 0.8 ps is illustrated in the inset, where the red particles represent those containing higher kinetic energy Ek and the blue particles those with lower Ek. (b) Distributions of density and velocity for 4X atoms along the z axis at t = 0.6 ps. The corresponding piston speed is vp = 50 km/s.

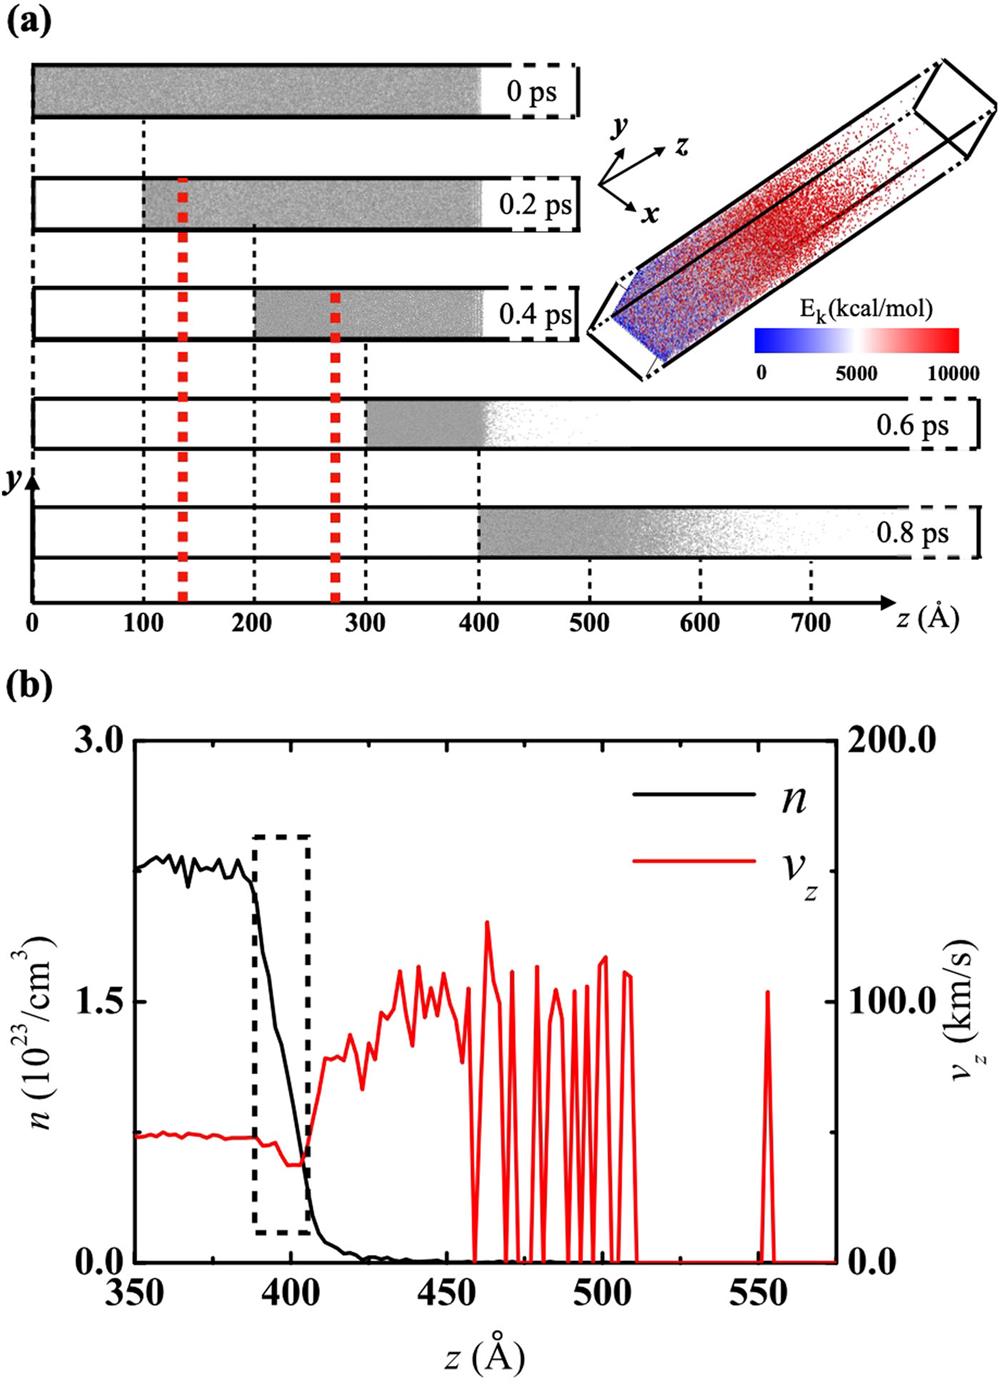
    Figure 1.(a) Setup of the NEMD simulations, where a shock wave propagates along the z axis. The red dashed lines indicate the positions of the shock front at 0.2 ps and 0.4 ps. The shock front emerges from the initial free surface (z = 400 Å) at about 0.6 ps. The three-dimensional structure of the medium at 0.8 ps is illustrated in the inset, where the red particles represent those containing higher kinetic energy Ek and the blue particles those with lower Ek. (b) Distributions of density and velocity for 4X atoms along the z axis at t = 0.6 ps. The corresponding piston speed is vp = 50 km/s.

    Before the arrival of the shock front, the interfacial regime between the medium and vacuum can be viewed as a perfect two-dimensional surface. However, after the breakout of the shock, the free surface is replaced by a regime of expanding plasma, and the position depends on how one measures it. Experimental devices, such as VISAR, rely on the Doppler effect to obtain the velocity of the interface.26 The position at which the reflection of the detecting laser takes place is essential to the measurements. In plasma environments, it is the critical number density of electrons nec that determines the position at which the detecting laser is reflected.42 The critical number density can be calculated as43nec = (2πc/λ)2meϵ0/e2, where λ is the wavelength of the laser, c is the speed of light, e and me are the electron charge and mass, and ϵ0 is the vacuum permittivity.

    Here, we may assume the critical number density of atoms to be nc = nec/2 for each X atom with two electrons, considering all electrons to be ionized under an ultra-strong shock as an illustrative simplification. Although the specific value of nc may deviate from this estimate owing to different degrees of ionization and separation between free electrons and ions,44 the behavior of vf will be quite similar so long as the value of nc is of the same order of magnitude, as we shall show in Sec. III. After nc has been determined, the slices along the z axis with their number density n ∈ [0.75nc, 1.25nc] are considered as the “reflecting surface” with a finite thickness. A more accurate estimate of the value of nc is beyond the scope of the present work. Such an estimate might be obtained with simulation techniques including a faithful description of excited electrons as well as the coupling effect between the radiation field and the hot dense plasma.

    III. RESULTS AND DISCUSSION

    We first present a microscopic picture of what happens after an ultra-strong shock arrives at the surface. With the NEMD simulations, one can have atomic resolution for the fine structure of shock fronts. Figure 1(a) displays the entire process of an ultra-strong shock meeting with and being bounced back by the initial free surface. Before the shock front, indicated by the red vertical dashed lines in the figure, touches the initial free surface, the shock wave propagates inside the medium with its microscopic structure depicted well in previous studies.38,44 The velocity of the shock wave is about vs = 68.9 km/s for mX = 4, corresponding to a piston speed vp = 50.0 km/s, a compression ratio η = 3.64, and a thickness of the shock front δ of about 24 Å. Note that the thickness of the shock front varies depending on its definition. Here, we follow the definition used in our previous work.38 After the shock front meets the initial free surface at z = 400 Å, a rarefaction wave is formed as the result of surface reflection. The formation of this rarefaction wave is illustrated in Fig. 1(b), where we plot the distributions of density and velocity along the z axis right after the shock breaks out. In the rarefaction wave regime (the rectangular area in the figure), the velocity is lower than that in the bulk medium, and the density is gradually increasing. These are typical features of a rarefaction wave.

    The appearance of a rarefaction wave is expected as a direct consequence of continuum hydrodynamic theories. However, continuum theories do not provide any information on how the materials ahead of the initial free surface move, and such information is critical for the measurement of vf. It can be seen from Fig. 1(a) that the transient regime between bulk medium and vacuum starts to move forward along the z axis after t = 0.6 ps, but the boundary is vague. From the distribution of velocity in Fig. 1(b), one can see that the velocity of the particles outside the free surface increases when the position is away from the surface. Meanwhile, the density decreases. At a distance far from the surface, the distribution of velocity consists of a number of spikes, which implies that a continuum description of the material is no longer valid.

    Nevertheless, the distributions of velocity and density provide a physical picture of how material leaves the initial free surface. Shortly after the shock front meets the initial free surface, the particles outside can be considered as leaving the surface at the same moment at which the shock breaks out. The density distribution f(z) in Fig. 1(b) actually reflects the number distribution f(vz) in velocity space at the very moment when the shock front meets the initial free surface. It follows an exponentially decay law similar to a Maxwellian distribution: f(z)=p1exp[p2(zz0)2], with fitting parameters z0 = 383.6 Å, p1 = 2.256 × 1023 cm3, and p2 = 3.404 × 10³ Å2. Thus, the process of material leaving the surface into vacuum is quite similar to the process of evaporation, as long as one observes it in the reference frame moving with the bulk material at velocity u.

    With this physical picture in mind, one can now consider how to determine vf. Since both density and velocity vary sharply with increasing distance from the initial free surface, as displayed in Fig. 1(b), vf depends strongly on the position of the reflecting surface. Here, we take nc = 2.348 × 1021 cm3, which corresponds to λ = 5000 Å. Note that this nc is the number density of X ions. The density of electrons is twice this quantity, assuming that both of the electrons are ionized. The evolution of vf with respect to time is displayed in Figs. 2(a)2(c) for three typical cases with vp = 75 km/s, 50 km/s, and 25 km/s, respectively. It shows that the measured surface speed vf agrees with the doubling rule only in a short transient period immediately after the shock front meets the initial free surface. For example, in Fig. 2(b), the average velocity along the z axis is 100 km/s at t = 0.6 ps, which is twice the velocity of particles behind the shock wave, namely, 50 km/s. However, the doubling rule remains valid only at times less than 200 fs, and therefore it cannot be picked up by experimental devices with a temporal resolution of several picoseconds.29 After that, vf increases further to reach a peak value and then slowly decays.

    Effects of atomic mass mX and piston speed vp on the velocity of the reflecting surface, vf. The reflecting surface is near nc = 2.348 × 1021 cm−3, and the piston speed is (a) vp = 75.0 km/s, (b) vp = 50.0 km/s, or (c) vp = 25.0 km/s.

    Figure 2.Effects of atomic mass mX and piston speed vp on the velocity of the reflecting surface, vf. The reflecting surface is near nc = 2.348 × 1021 cm3, and the piston speed is (a) vp = 75.0 km/s, (b) vp = 50.0 km/s, or (c) vp = 25.0 km/s.

    To find out how competition between kinetic and potential energies affects the evolution of vf, we also vary the atomic mass of the X ions from 3 to 10 in the simulations. In this way, we can keep vs roughly the same at a given piston speed vp,20,38 while changing the ratio between kinetic and potential energies. For example, for the case in which the piston is pushed forward at vp = 50 km/s, the measured η = 3.64, and no apparent variation is observed. The measured vs varies from 66.7 km/s (in the case of 10X) to 69.4 km/s (in the case of 3X), which fluctuate around the value vs = 68.9 km/s calculated under the continuum condition. Figure 2 reveals that the potential energy affects the evolution of vf only in the acceleration phase, which is a short period less than 2 ps. After that, the vf values for different atomic masses converge together, displaying some features of scaling invariance.

    Another important factor that may affect the measurement of vf is the wavelength λ of the detecting laser. Since nc is proportional to 1/λ2, detecting lasers of different wavelengths will be reflected on the surface at points corresponding to their particular value of nc. Thus, vf of that surface depends on λ. The velocities of the reflecting surfaces for selected values of nc are plotted in Fig. 3. It can be seen that vf for each nc has a single-peaked structure similar to those in Fig. 2. In addition, vf will reach a converged value independent of the atomic mass of X (but depending on the detecting wavelength) after a period of acceleration, regardless of the wavelength of the detecting laser.

    Effect of critical number density nc on vf. Two isotopes of X, namely, 4X and 8X, are taken as examples.

    Figure 3.Effect of critical number density nc on vf. Two isotopes of X, namely, 4X and 8X, are taken as examples.

    The trend that vf converges to a value independent of the atomic mass of X can be attributed to two competing mechanisms. The acceleration mechanism comes mainly from the pressure gradient. The distributions of pressure along the z axis are shown in Fig. 4 for the case vp = 50 km/s and a detecting wavelength of 5000 Å. For the purpose of comparison, the pressure contributions for 4X ions are plotted as solid curves, while those for 8X ions are plotted as dashed curves. Figure 4(a) shows the distribution of pressure contributions at t = 0.6 ps, at which vf is in the acceleration phase, and Fig. 4(b) shows the distribution at a time (t = 2.0 ps) when vf is not affected by the mass of X. The pressure contribution originating from kinetic energy is called the thermal pressure and denoted by pth. It is proportional to the average kinetic energy Ek of particles as pth=23nEk.38 The contribution from interaction is called the virial pressure and denoted by pvirial. The region between each pair of dashed vertical lines of the same color is the thin layer of the “reflecting surface” in which the number density of X is between 0.75nc and 1.25nc, as described in Sec. II. Note that this region is not the same for different atomic masses: the regions for 4X and 8X ions are distinguished by different colors. It can be seen from Fig. 4 that there is a pressure gradient across the thin layer, which pushes the layer forward with a certain acceleration. From the insets in Figs. 4(a) and 4(b), it can also be seen that this acceleration decreases with time, as the result of a decreasing pressure gradient.

    Distributions of thermal and virial pressures at (a) t = 0.6 ps and (b) t = 2.0 ps. The areas between the black vertical dashed lines and between the orange vertical dashed lines represent the ranges of the reflecting surfaces of the 4X and 8X media, respectively. The critical number density determining the reflecting surface is nc = 2.348 × 1021 cm−3 for both media.

    Figure 4.Distributions of thermal and virial pressures at (a) t = 0.6 ps and (b) t = 2.0 ps. The areas between the black vertical dashed lines and between the orange vertical dashed lines represent the ranges of the reflecting surfaces of the 4X and 8X media, respectively. The critical number density determining the reflecting surface is nc = 2.348 × 1021 cm3 for both media.

    To quantitatively compare the influence of the pressure gradient on the acceleration, all pressure contributions presented in Fig. 4 are divided by the relative atomic mass of the ions. It is found that the acceleration provided by thermal pressure is nearly the same, since the blue dashed curves are close to the solid black curves in Fig. 4. This is easy to understand, because pth is proportional to atomic mass by definition. However, the effect of the virial pressure differs greatly among the different cases. In Fig. 4(a), where vf is in the acceleration phase, pvirial is of the same order of magnitude as pth in the region of bulk material far behind the reflecting surface. In the vicinity of the reflecting surface, pvirial of 4X is even larger than pth, while pvirial of 8X is less than 1% of pth. On the other hand, pvirial is less than 10% of pth in the region containing bulk material in Fig. 4(b), where vf is independent of the atomic mass of the ions. In the inset in Fig. 4(b), the contribution from interaction, pvirial, is almost unobservable near the reflecting surface. Therefore, one can conclude that the pressure gradient resulting from interaction, i.e., from pvirial, is the origin of the different accelerations of vf in the acceleration phase shown in Fig. 2.

    The average particle flow in the vicinity of the reflecting surface provides a deceleration mechanism. The physical picture is as follows. When the reflecting surface, which is actually a thin layer microscopically, moves forward, some particles leave the layer and enter the region ahead. The majority of these particles have a speed higher than vf. Meanwhile, more particles join the layer from behind, most of which have speeds lower than vf. The decelerating effect on vf comes mainly from those particles joining the layer with lower speed and those leaving with higher speed. The overall effect is that the particles in the layer are gradually replaced by the particles behind the reflecting surface, and this eventually leads to a decrease in vf.

    The distributions of number density and velocity are shown in Fig. 5, where we again take 4X and 8X as examples. At t = 0.8 ps, both the local average velocity vz along the z axis and the number density n differ between the two atomic masses, as can be seen from Figs. 5(a) and 5(b). However, at t = 2.0 ps, the distributions of vz and n are almost the same for the two atomic masses. This suggests that the system evolves to a state in which the dynamics along the z axis is insensitive to atomic mass. This results from expansion of high-temperature plasma in the transient regime, which makes the potential energy much smaller than the kinetic energy. The dynamical behavior of the system is thus dominated by the kinetic energy, which accounts for the insensitivity of vz and n to mX in Figs. 5(c) and 5(d).

    Comparison of the distributions of number density and velocity. (a) and (b) show the number density and velocity, respectively, in the z direction at t = 0.8 ps, while (c) and (d) show those at t = 2.0 ps. The areas between the black vertical dashed lines and between the orange vertical dashed lines represent the ranges of the reflecting surfaces of the 4X and 8X media, respectively. The critical number density determining the reflecting surface is nc = 2.348 × 1021 cm−3 for both media.

    Figure 5.Comparison of the distributions of number density and velocity. (a) and (b) show the number density and velocity, respectively, in the z direction at t = 0.8 ps, while (c) and (d) show those at t = 2.0 ps. The areas between the black vertical dashed lines and between the orange vertical dashed lines represent the ranges of the reflecting surfaces of the 4X and 8X media, respectively. The critical number density determining the reflecting surface is nc = 2.348 × 1021 cm3 for both media.

    f(t̃)=1+b1t̃+c1t̃2+d1t̃31+b2t̃+c2t̃2+d2t̃3,with the best-fitting coefficients for all atomic masses and shock speeds listed in Table I.

    ParameterValueParameterValue
    a01.394a5−0.013 33
    a11.356a62.122 × 104
    a2−0.076 86a75.181 × 104
    a3−4.262 × 10⁻³a81.570 × 10−6
    a4−4.282 × 10⁻³
    b11.736 × 105d16.654 × 103
    b21.762 × 105d25.240 × 103
    c16.890 × 104
    c23.576 × 104

    Table 1. Best fitting parameters for the scaling law of vf.

    Figure 6 shows ṽf/α obtained in all of our simulations as a function of t̃, with atomic mass varying from 3 to 10 and piston speed from 25 km/s to 75 km/s. The dimensionless function ṽf/α with the best-fitting parameters is also displayed as a dashed curve. It can be seen that under the scaling transformations vfvf/(αcs) and tt0 → (tt0)cs/l0, vf can be described well by a unified function of scaled time. The figure also reveals that vf may be 30%–40% higher than the estimate from the doubling rule. This value may not be applied directly to improve experimental measurements, since it is obtained from simulations that do not take the motion of electrons into consideration. However, it does show that overestimation of particle velocity u in experimental measurements via the doubling rule should be considered, which leads further to overestimation of η. To use the scaling law to correct the overestimation in practice, one may first determine the forms of α(M) and f(t̃) in Eqs. (6) and (7) by comparing the experimental results and theoretical calculations for selected values of η and then obtain corrections for all experimental points.

    Scaling law of vf. The blue dashed line represents the best-fitting curve, and the scattered dots are the simulation results for various piston speeds and atomic masses, as shown in the key.

    Figure 6.Scaling law of vf. The blue dashed line represents the best-fitting curve, and the scattered dots are the simulation results for various piston speeds and atomic masses, as shown in the key.

    IV. CONCLUSION

    In summary, we have used NEMD simulations to provide an atomic-scale picture of the dynamics of particles near the surface of a medium under ultra-strong shocks. This has revealed that vf under ultra-strong shocks has a single-peaked structure. After a short period of acceleration, vf exhibits a long slowly decaying tail, which is not sensitive to the atomic mass of the medium. A scaling law has also been revealed to describe the dynamics of vf, and this may be used to improve the measurement of particle velocity u in future experiments.

    References

    [1] P. A. Sterne, P. M. Celliers, M. Millot et al. Measuring the shock impedance mismatch between high-density carbon and deuterium at the National Ignition Facility. Phys. Rev. B, 97, 144108(2018).

    [2] J. Zheng, Q. F. Chen, Y. J. Gu et al. Shock-adiabatic to quasi-isentropic compression of warm dense helium up to 150 Gpa. Phys. Rev. B, 95, 224104(2017).

    [3] A. L. Kritcher, D. C. Swift, T. Doppner et al. Absolute equation-of-state measurement for polystyrene from 25 to 60 Mbar using a spherically converging shock wave. Phys. Rev. Lett., 121, 025001(2018).

    [4] C. A. McCoy, M. C. Gregor, D. N. Polsin et al. Shock-wave equation-of-state measurements in fused silica up to 1600 Gpa. J. Appl. Phys., 119, 215901(2016).

    [5] Z. G. Li, Q. F. Chen, Y. J. Gu et al. Multishock compression of dense cryogenic hydrogen-helium mixtures up to 60 Gpa: Validating the equation of state calculated from first principles. Phys. Rev. B, 98, 064101(2018).

    [6] H. Stabile, D. Batani et al. Hugoniot data for carbon at megabar pressures. Phys. Rev. Lett., 92, 065503(2004).

    [7] A. Balducci, D. Batani et al. Equation of state data for gold in the pressure range <10 TPa. Phys. Rev. B, 61, 9287(2000).

    [8] A. Morelli, D. Batani et al. Equation of state data for iron at pressure beyond 10 mbar. Phys. Rev. Lett., 88, 235502(2002).

    [9] K. A. Tanaka, N. Ozaki et al. Gekko/hiper-driven shock waves and equation-of-state measurements at ultrahigh pressures. Phys. Plasmas, 11, 1600(2004).

    [10] N. Ozaki, T. Ono et al. Equation-of-state measurements for polystyrene at multi-tpa pressures in laser direct-drive experiments. Phys. Plasmas, 12, 124503(2005).

    [11] K. Jakubowska et al. Theoretical and experimental refraction index of shock compressed and pre-compressed water in the megabar pressure range. Eur. Phys. Lett., 126, 56001(2019).

    [12] M. Koenig et al. Relative consistency of equation of state by laser driven shock waves. Phys. Rev. Lett., 74, 2260(1995).

    [13] T. Doppner, D. C. Swift, A. L. Kritcher et al. A measurement of the equation of state of carbon envelopes of white dwarfs. Nature, 584, 51(2020).

    [14] J. Lindl. Development of the indirect-drive approach to inertial confinement fusion and the target physics basis for ignition and gain. Phys. Plasmas, 2, 3933(1995).

    [15] Y. Liu, Z. Fan, B. Liu et al. Non-equilibrium between ions and electrons inside hot spots from National Ignition Facility experiments. Matter Radiat. Extremes, 2, 3(2017).

    [16] E. M. Campbell, T. C. Sangster, V. N. Goncharov et al. Laser-direct drive program: Promise, challenge and path forward. Matter Radiat. Extremes, 2, 37(2017).

    [17] M. E. Martin, J. Nilsen, A. L. Kritcher et al. Understanding the effects of radiative preheat and self-emission from shock heating on equation of state measurement at 100s of Mbar using spherically converging shock waves in a NIF hohlraum. Matter Radiat. Extremes, 5, 018410(2020).

    [18] J. A. Gaffney, P. Arnault, S. X. Hu et al. A review of equation-of-state models for inertial confinement fusion materials. High Energy Density Phys., 28, 7(2018).

    [19] Z. F. Fan, J. W. Li, X. T. He et al. A hybrid-drive nonisobaric-ignition scheme for inertial confinement fusion. Phys. Plasmas, 23, 082706(2016).

    [20] Y. P. Raizer, Y. B. Zel’dovich. Physics of Shock Waves and High-Temperature Hydrodynamic Phenomena(1967).

    [21] J. M. Walsh, R. H. Christian. Equation of state of metals from shock wave measurements. Phys. Rev., 97, 1544-1556(1955).

    [22] J. M. Walsh, M. H. Rice, R. G. Mcqueen et al. Shock-wave compressions of twenty-seven metals. Equations of state of metals. Phys. Rev., 108, 196-216(1957).

    [23] G. Huser, A. Benuzzi-Mounaix, M. Koenig et al. Absolute equation of state measurements of iron using laser driven shocks. Phys. Plasmas, 9, 2466(2002).

    [24] K. K. Krupnikov, L. V. Al’tshuler, B. N. Ledenev et al. Dynamic compressibility and equation of state of iron under high pressure. Sov. Phys. JETP., 7, 606(1958).

    [25] L. V. Al’tshuler, S. B. Kormer, A. A. Bakanova et al. Equation of state for aluminum, copper, and lead in the high pressure region. Sov. Phys. JETP., 11, 573(1960).

    [26] R. E. Hollenbach, L. M. Baker. Laser interferometer for measuring high velocities of any reflecting surface. J. Appl. Phys., 43, 4669-4675(1972).

    [27] D. R. Goosman. Analysis of the laser velocity interferometer. J. Appl. Phys., 46, 3516-3524(1975).

    [28] P. M. Celliers, G. W. Collins, L. B. D. Silva et al. Accurate measurement of laser-driven shock trajectories with velocity interferometry. Appl. Phys. Lett., 73, 1320-1322(1998).

    [29] D. K. Bradley, G. W. Collins, P. M. Celliers et al. Line-imaging velocimeter for shock diagnostics at the OMEGA laser facility. Rev. Sci. Instrum., 75, 4916-4929(2004).

    [30] W. F. Hemsing. Velocity sensing interferometer (VISAR) modification. Rev. Sci. Instrum., 50, 73-78(1979).

    [31] G. W. Collins, P. M. Celliers, L. B. D. Silva et al. Shock-induced transformation of liquid deuterium into a metallic fluid. Phys. Rev. Lett., 84, 5564-5567(2000).

    [32] D. G. Hicks, G. Collins, P. M. Celliers et al. Shock-induced transformation of Al2O3 and LiF into semiconducting liquids. Phys. Rev. Lett., 91, 035502(2003).

    [33] P. Loubeyre, P. M. Celliers, D. G. Hicks et al. Coupling static and dynamic compressions: First measurements in dense hydrogen. High Pressure Res., 24, 25-31(2004).

    [34] T. R. Boehly, W. Seka, V. N. Goncharov et al. Velocity and timing of multiple spherically converging shock waves in liquid deuterium. Phys. Rev. Lett., 106, 195001(2011).

    [35] S. Zhang, B. Militzer, A. Lazicki et al. Equation of state of boron nitride combining computation, modeling, and experiment. Phys. Rev. B, 99, 165103(2019).

    [36] D. H. Dolan. What does ‘velocity’ interferometry really measure. AIP Conf. Proc., 1159, 589(2009).

    [37] B. L. Holian, E. Salomons, C. W. Patterson, M. Mareschal. Modeling shock wave in an ideal gas: Going beyond the Navier-Stokes level. Phys. Rev. E., 47, R24-R27(1993).

    [38] Q. Zhang, H. Liu, W. Kang et al. Molecular dynamics simulations of microscopic structure of ultra strong shock waves in dense helium. Front. Phys., 11, 115206(2016).

    [39] S. Plimpton, P. Crozier, A. Thompson. Lammps-Large-Scale Atomic/Molecular Massively Parallel Simulator(2007).

    [40] L. Verlet. Computer ‘experiments’ on classical fluids. I. Thermodynamical properties of Lennard-Jones molecules. Phys. Rev., 159, 98-103(1967).

    [41] R. A. Aziz, J. S. Carley, V. P. S. Nain et al. An accurate intermolecular potential for helium. J. Chem. Phys., 70, 4330(1979).

    [42] M. Koenig, A. Benuzzi, B. Faral et al. Preheating study by reflectivity measurements in laser-driven shocks. Phys. Plasmas, 5, 2410(1998).

    [43] P. Gibbon. Short Pulse Laser Interactions with Matter(2005).

    [44] H. Liu, W. Kang, Y. Zhang et al. Molecular dynamics simulation of strong shock waves propagating in dense deuterium, taking into consideration effects of excited electrons. Phys. Rev. E., 95, 023201(2017).

    [45] G. A. Baker. Essentials of Padé Approximants(1975).

    Zixiang Yan, Hao Liu, Xinyu Zhang, Guoli Ren, Jie Liu, Wei Kang, Weiyan Zhang, Xiantu He. Dynamics of particles near the surface of a medium under ultra-strong shocks[J]. Matter and Radiation at Extremes, 2021, 6(2): 026903
    Download Citation