• Photonics Research
  • Vol. 12, Issue 1, 27 (2024)
Changsheng Zheng1, Tianyi Du1, Lei Zhu1, Zhanxin Wang1, Kangzhen Tian1、4, Yongguang Zhao1、*, Zhiyong Yang1, Haohai Yu2, and Valentin Petrov3
Author Affiliations
  • 1Jiangsu Key Laboratory of Advanced Laser Materials and Devices, School of Physics and Electronic Engineering, Jiangsu Normal University, Xuzhou 221116, China
  • 2State Key Laboratory of Crystal Materials and Institute of Crystal Materials, Shandong University, Jinan 250100, China
  • 3Max Born Institute for Nonlinear Optics and Short Pulse Spectroscopy, 12489 Berlin, Germany
  • 4e-mail: kangzhentian@jsnu.edu.cn
  • show less
    DOI: 10.1364/PRJ.507488 Cite this Article Set citation alerts
    Changsheng Zheng, Tianyi Du, Lei Zhu, Zhanxin Wang, Kangzhen Tian, Yongguang Zhao, Zhiyong Yang, Haohai Yu, Valentin Petrov. Direct amplification of femtosecond optical vortices in a single-crystal fiber[J]. Photonics Research, 2024, 12(1): 27 Copy Citation Text show less
    Schematic of the two-stage amplification system for the FOV with azimuthal mode index of |l|=8, and the homemade Mach–Zehnder interferometer containing a delay line in one arm. Insets show the intensity profiles of the seed beam before and after passing through the SPP and PH, and the interferograms obtained with off-axis and co-axis self-reference measurements. DM, dichroic mirror; ISO, isolator; SPP, spiral phase plate; PH, pinhole; PBS, polarization beam splitter; L, lens; SCF, single-crystal fiber; LD, laser diode; PM, power meter; OSA, optical spectrum analyzer; FROG, frequency-resolved optical gating.
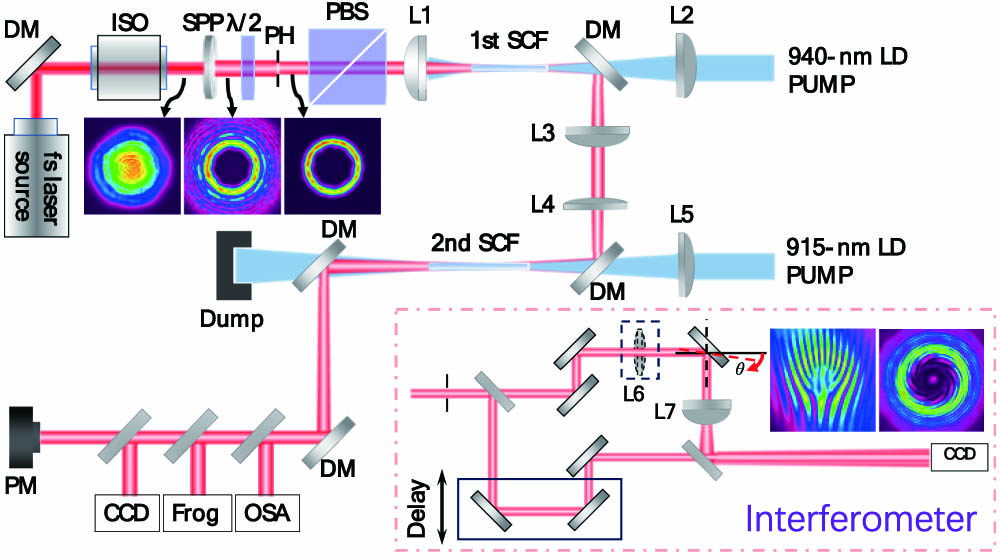
    Fig. 1. Schematic of the two-stage amplification system for the FOV with azimuthal mode index of |l|=8, and the homemade Mach–Zehnder interferometer containing a delay line in one arm. Insets show the intensity profiles of the seed beam before and after passing through the SPP and PH, and the interferograms obtained with off-axis and co-axis self-reference measurements. DM, dichroic mirror; ISO, isolator; SPP, spiral phase plate; PH, pinhole; PBS, polarization beam splitter; L, lens; SCF, single-crystal fiber; LD, laser diode; PM, power meter; OSA, optical spectrum analyzer; FROG, frequency-resolved optical gating.
    Simulated pump light spatial intensity distribution in the SCFs, where (a) represents the first-stage 30-mm-long SCF pumped by the 940-nm LD, (b) displays the second-stage 40-mm-long SCF pumped by the 915-nm LD, and (c) shows the corresponding normalized on-axis intensity distribution along the SCFs.
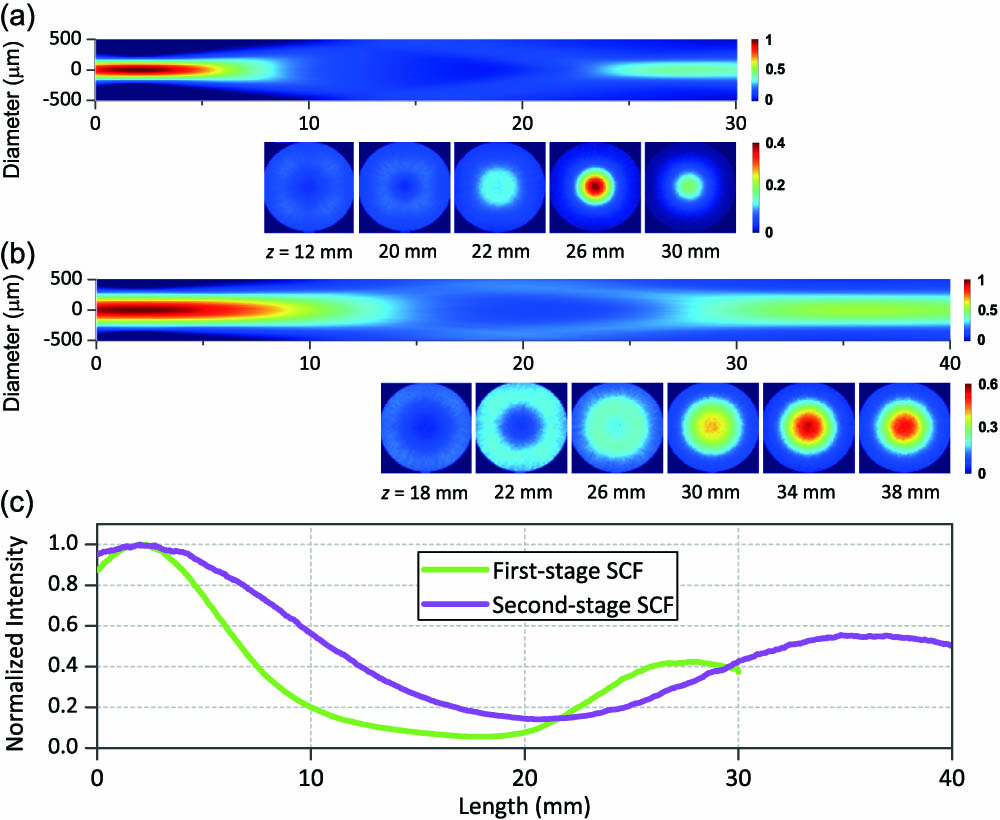
    Fig. 2. Simulated pump light spatial intensity distribution in the SCFs, where (a) represents the first-stage 30-mm-long SCF pumped by the 940-nm LD, (b) displays the second-stage 40-mm-long SCF pumped by the 915-nm LD, and (c) shows the corresponding normalized on-axis intensity distribution along the SCFs.
    Average laser power and the corresponding gain of the (a) SCF amplifier stages and (b) power stability measurement. The bottom panel shows the recorded far-field (FF) and near-field (NF) intensity profiles and the corresponding self-interference patterns, where (c)–(e) correspond to the seed beam at 2 W, (f)–(h) show the FOV after the first amplifier stage at 12.5 W, (i)–(k) show the laser beam at 10.3 W which serves as a seed for the second amplifier stage, and (l)–(n) correspond to the second stage output at the highest power of 23 W. RMS, root mean square.
    Fig. 3. Average laser power and the corresponding gain of the (a) SCF amplifier stages and (b) power stability measurement. The bottom panel shows the recorded far-field (FF) and near-field (NF) intensity profiles and the corresponding self-interference patterns, where (c)–(e) correspond to the seed beam at 2 W, (f)–(h) show the FOV after the first amplifier stage at 12.5 W, (i)–(k) show the laser beam at 10.3 W which serves as a seed for the second amplifier stage, and (l)–(n) correspond to the second stage output at the highest power of 23 W. RMS, root mean square.
    (a) Spectral evolution of the FOV in the two-stage SCF amplifier system, and the SHG-FROG characterization (256×256 grids) of the FOV (b) after the first amplifier stage at an average output power 12.5 W and (c) after the second stage at 23 W.
    Fig. 4. (a) Spectral evolution of the FOV in the two-stage SCF amplifier system, and the SHG-FROG characterization (256×256 grids) of the FOV (b) after the first amplifier stage at an average output power 12.5 W and (c) after the second stage at 23 W.
    (a) Intensity profile, (b) off-axis interference fringe pattern, and (c) the retrieved screw-like phase structure for the 12.5-W FOV from the first amplification stage. (d)–(f) represent the corresponding images after the second amplification stage at 23 W. (g) shows the calculated relative modal weighting for both cases.
    Fig. 5. (a) Intensity profile, (b) off-axis interference fringe pattern, and (c) the retrieved screw-like phase structure for the 12.5-W FOV from the first amplification stage. (d)–(f) represent the corresponding images after the second amplification stage at 23 W. (g) shows the calculated relative modal weighting for both cases.
    Changsheng Zheng, Tianyi Du, Lei Zhu, Zhanxin Wang, Kangzhen Tian, Yongguang Zhao, Zhiyong Yang, Haohai Yu, Valentin Petrov. Direct amplification of femtosecond optical vortices in a single-crystal fiber[J]. Photonics Research, 2024, 12(1): 27
    Download Citation