
J. Hornung, Y. Zobus, P. Boller, C. Brabetz, U. Eisenbarth, T. Kühl, Zs. Major, J. B. Ohland, M. Zepf, B. Zielbauer, V. Bagnoud. Enhancement of the laser-driven proton source at PHELIX[J]. High Power Laser Science and Engineering, 2020, 8(2): 02000e24
- High Power Laser Science and Engineering
- Vol. 8, Issue 2, 02000e24 (2020)
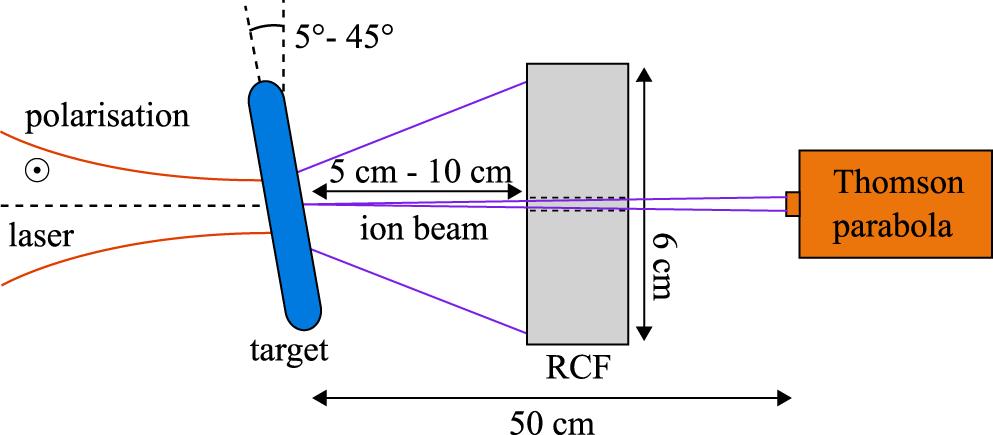
Fig. 1. Top view of the basic setup used for laser-ion acceleration at which the laser is focused onto a thin target with varying incidence angle. The accelerated ions are captured by an RCF stack placed in the laser direction, together with a Thomson parabola, for the first setup and are rotated together with the target for the second setup.
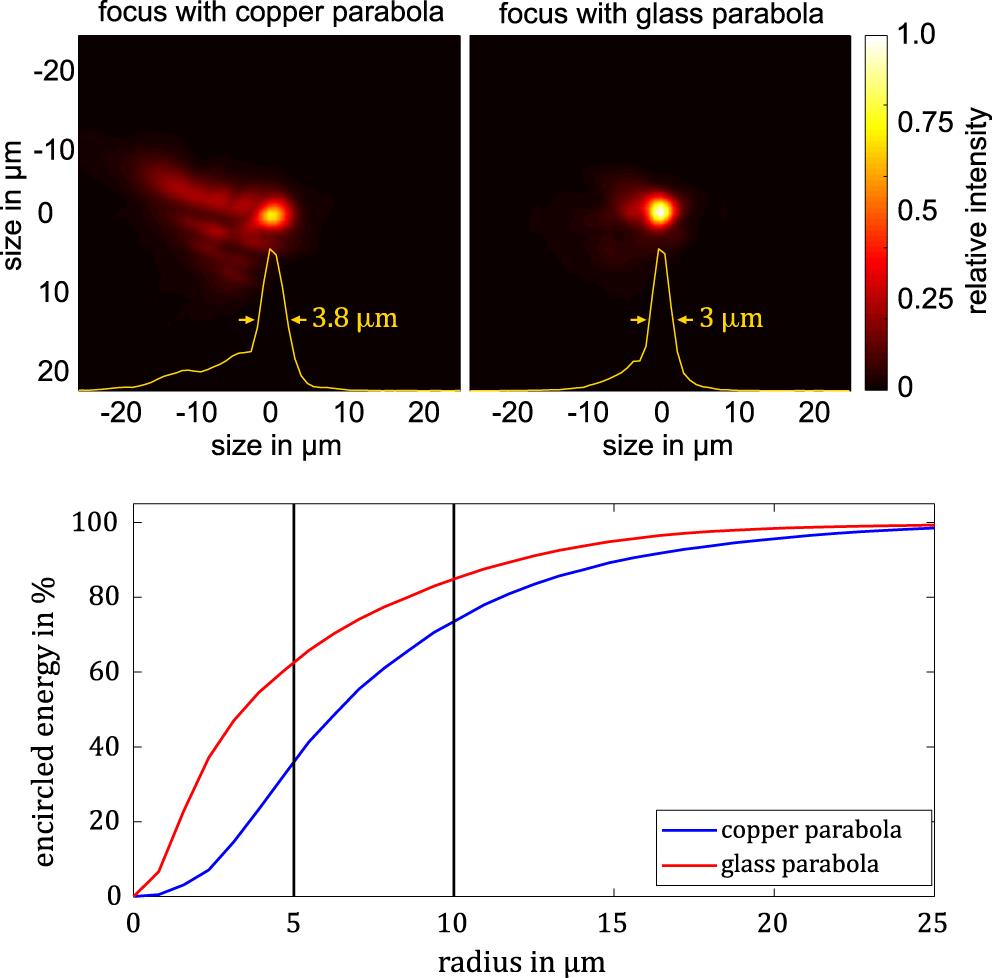
Fig. 2. Comparison of the focal spot of the copper and glass parabolas, taken during alignment mode inside the target chamber, showing the improvement introduced by the new optic (upper half). The yellow curve corresponds to a lineout over the horizontal direction through the centre, which additionally shows the FWHM of the foci. The lower part of the figure shows the comparison of the encircled energy for both parabolas.
Fig. 3. Scaling of the maximum proton energy in dependence on the laser intensity for different focusing optics and target thicknesses. The black dots correspond to the copper parabola with 300 nm target thickness, whereas the blue and red dots belong to the glass parabola with target thicknesses of 300 nm and  , respectively. The black and blue lines correspond to a fit that is proportional to
  for the copper and glass parabolas, respectively.
, respectively. The black and blue lines correspond to a fit that is proportional to for the copper and glass parabolas, respectively. Fig. 4. Data of the PHELIX record shot showing proton energies of at least 90 MeV with a possible extension up to 93 MeV. Image (a) shows the signal at the last five EBT-layers, whereas the contrast has been enhanced to increase the visibility of the proton signal. The yellow arrow indicates the position of the highest energetic protons, close to the hole, which is used to obtain the Thomson parabola trace, shown in image (b). The lines and numbers correspond to the position and thickness in mm of the copper filters introduced in Section 2 . The spectrum that is extracted from this trace is shown in figure (c), showing a transition to the background level at 85–90 MeV.
Fig. 5. Scaling of the maximum proton energy in dependence on the laser power for different focusing optics for the same parameters as shown in Figure 3 . The lines correspond to the laser power scaling mentioned by Zeil et al. [20].
Fig. 6. Maximum proton energy depending on the laser peak power for different laser and setup parameters at  incidence angle. The lines show the corresponding laser-power fit by Zeil
 et al. [20].
incidence angle. The lines show the corresponding laser-power fit by Zeil Fig. 7. Proton spectrum for each configuration with comparable laser power on target. The exponential function is obtained by an iterative fit to the deposited energy in the RCF layers, whereas the circles are obtained by sequential deconvolution of the signal from the last layer from the previous ones.
Fig. 8. Comparison of the maximum proton energy scaling dependent on the laser peak power for the first beamtime (blue) and the p-polarization setup (red), both conducted with a high contrast. Despite the large angle difference of  , the scaling is similar in both cases.
, the scaling is similar in both cases. 
Set citation alerts for the article
Please enter your email address
© Copyright 2018-2021 | Chinese Laser Press. All Rights Reserved 沪ICP备15018463号-20