Author Affiliations
1Institute of Applied Physics, Abbe Center of Photonics, Friedrich Schiller University Jena, 07745 Jena, Germany2Institute of Solid State Physics, Friedrich Schiller University Jena, 07743 Jena, Germany3Research Department of Nanooptics, Leibniz Institute of Photonic Technology, 07745 Jena, Germany4Fraunhofer-Institute for Applied Optics and Precision Engineering IOF, 07745 Jena, Germanyshow less
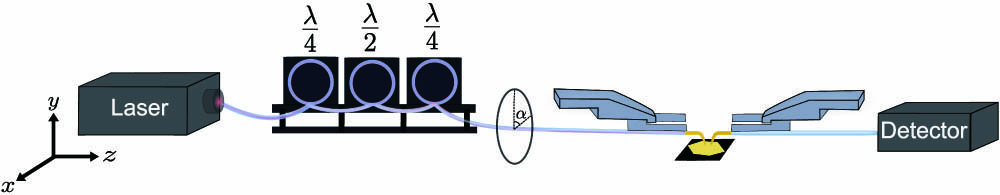
Fig. 1. Dual-tip SNOM setup for characterizing the polarization of the emission from the excitation aperture tip. The laser beam with a polarization angle α is coupled to the end of the fiber tip. The emission from the aperture tip at its apex excites SPPs on a monocrystalline gold platelet. The detection tip maps the near-field pattern of the excited SPPs.
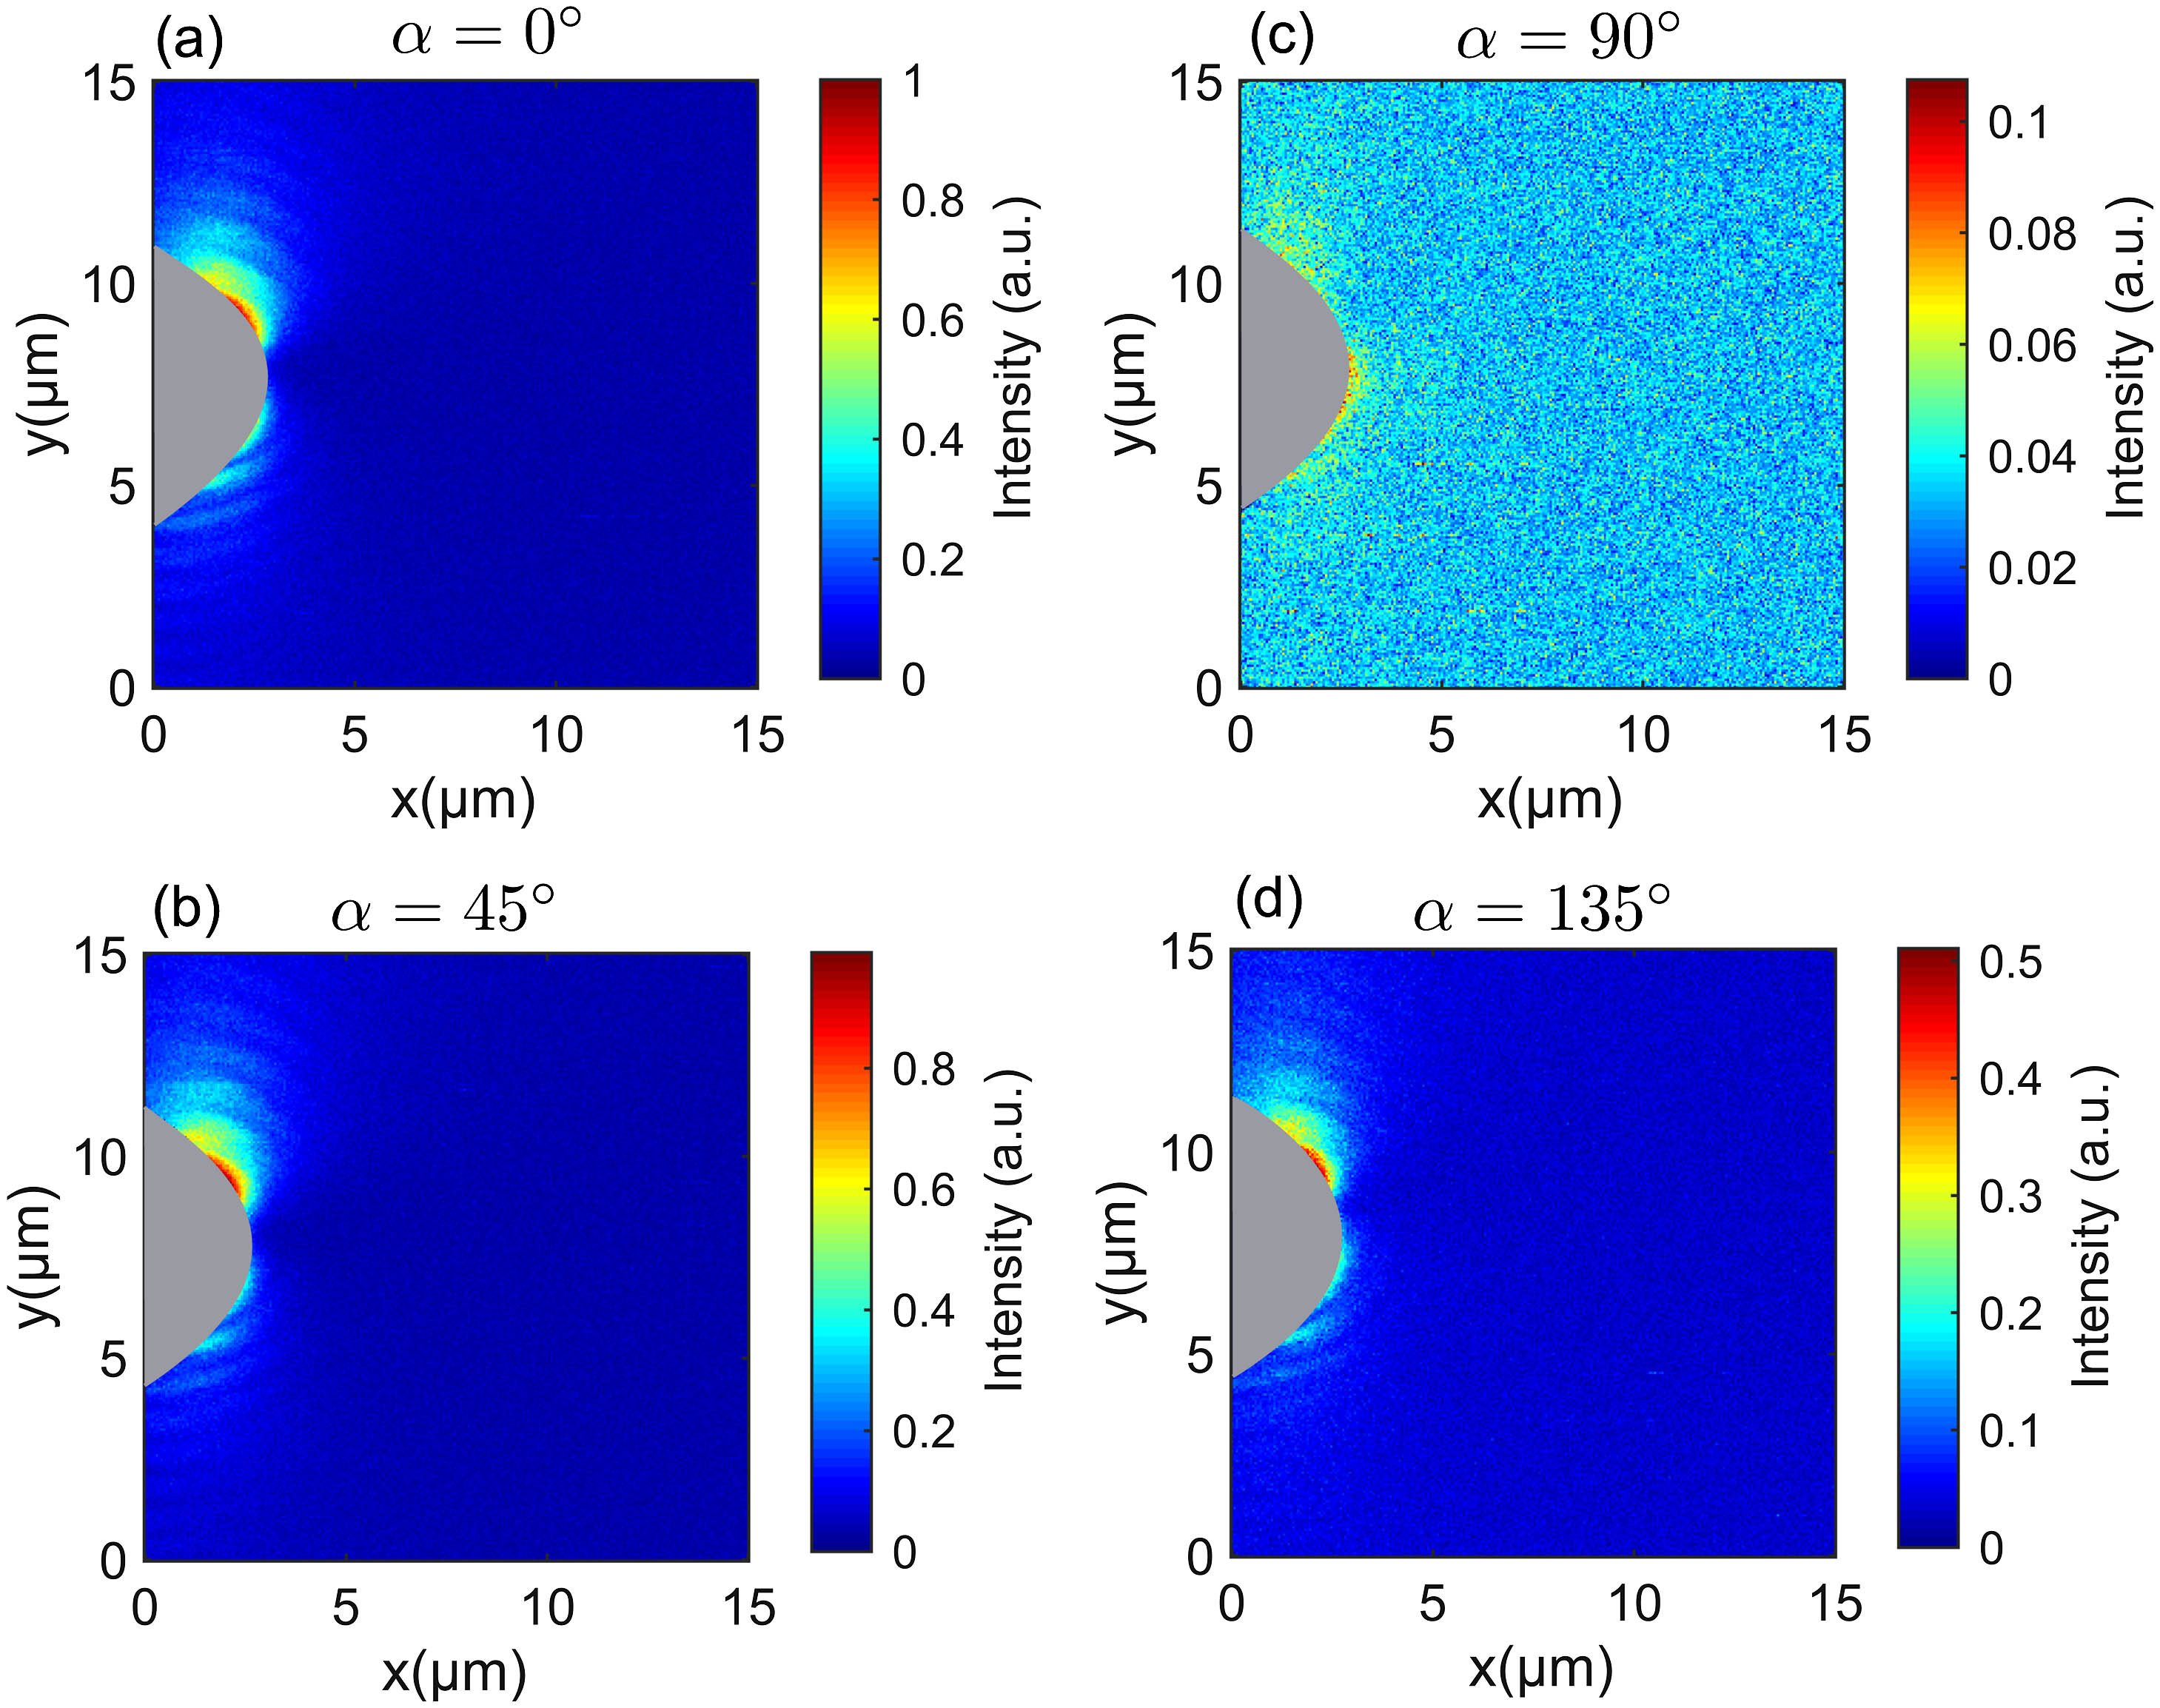
Fig. 2. Near-field intensity maps of the excited SPPs for different input polarization angles (α) of the laser beam coupled to the end of the fiber tip: (a) α=0°, (b) α=90°, (c) α=45°, and (d) α=135°. The intensity in each panel was divided by the maximum obtained intensity from all the different measured polarization angles. The gray region shows the avoidance area.
Fig. 3. (a) Excitation and detection tips with an angle θ′ relative to the surface normal. The coordinate system of the detection tip x′yz′ is obtained by rotating the sample coordinate system xyz around the y axis with an angle θ′. (b) Green double arrow denotes a magnetic dipole with azimuthal φ and polar θ angles. (c) Schematic of an aperture tip whose aperture plane at the apex is tilted relative to the incident beam (red vector). The incident beam makes an angle β with respect to the aperture plane normal (red dashed line). The blue double arrow represents an electric dipole, which mimics the beam that reaches the subwavelength part of the apex.
Fig. 4. Numerically calculated near-field intensity maps of the electric and magnetic field components of the excited SPPs, in a plane z=15 nm above a gold film, when the excitation plane is z=30 nm above the gold film. Semi-transparent gray parabolic regions represent the avoidance area in dual-tip SNOM measurements. Different configurations have been considered for the SPP excitation: (a) magnetic dipole (green double arrow) with angles θ=90° and φ=90°; (b) truncated cone with the symmetry axis normal to the surface (the blue double arrow shows an electric dipole); (c) tilted magnetic dipole with θ=60° and φ=90°; (d) truncated cone with the symmetry axis making an angle θ′=30° with respect to the surface normal. The simulation plane is located 15 nm above the gold film and 15 nm below the lowest part of the aperture tip. The intensity of each one of the electric (magnetic) field components is normalized to the maximum of the total electric (magnetic) field intensity. The value at the corner of each panel denotes the normalized intensity of the corresponding component.
Fig. 5. SEM images of the (a) excitation and (b) detection tips. (c) Measured near-field intensity patterns of the SPPs generated by the excitation aperture tip near a gold platelet. (d) Corresponding calculated magnetic field intensity (at a distance z=30 nm from the air–gold interface) of the SPPs excited by a magnetic dipole with angles θ=60° and φ=0°. Numerical simulations of the (e) electric and (f) magnetic field intensity components corresponding to the near-field patterns of the excited SPPs. The number in the lower corners indicates the value of the normalized intensity in each panel. The simulated near-field patterns are calculated in the detection tip coordinates.
Fig. 6. SEM images of the (a) excitation and (b) detection tips. (c) Measured near-field intensity patterns of the SPPs generated by the excitation aperture tip near a gold platelet. (d) Corresponding calculated magnetic field intensity (at a distance z=30 nm from the air–gold interface) of the SPPs excited by a magnetic dipole with angles θ=60° and φ=90°. Numerical simulations of the (e) electric and (f) magnetic field intensity components corresponding to the near-field patterns of the excited SPPs. The number in the lower corners indicates the value of the normalized intensity in each panel. The simulated near-field patterns are calculated in the detection tip coordinates.
Fig. 7. SEM images of the (a) excitation and (b) detection tips. (c) Measured near-field intensity patterns of the SPPs generated by the excitation aperture tip near a gold platelet. (d) Corresponding calculated magnetic field intensity (at a distance z=30 nm from the air–gold interface) of the SPPs excited by a magnetic dipole with angles (θm=60°, φm=0°) and an electric dipole with angles (θe=30°, φe=180°). Numerical simulations of the (e) electric and (f) magnetic field intensity components corresponding to the near-field patterns of the excited SPPs. The number in the lower corners indicates the value of the normalized intensity in each panel. The simulated near-field patterns are calculated in the detection tip coordinates.