This Letter demonstrates a novel lateral shear interferometer system for simultaneous measurement of three-dimensional (3D) shape and thickness of transparent objects. Multi-frequency fringe patterns can be created by tilting mirrors at different inclination angles. With a single camera, the multi-frequency fringes are recorded in one image. The phase-shift of the fringes can be generated synchronously only by moving a plane-parallel plate along an in-plane parallel direction. According to the feature of transparent materials, the thickness and 3D shape can be reconstructed simultaneously based on the relationship between the in-plane displacement and their characteristics. The experiment was conducted on a thin transparent film subjected to a shearing force, which verifies the feasibility of the proposed system.
Thickness and three-dimensional (3D) shape are fundamental characteristics of transparent films and optical materials, especially for devices used as sensors and packages. In some circumstances, external stress can induce a variety of undesirable consequences, including a change in the thickness and shape of the devices used in engineering systems. Different optical methods have been applied to measure the thickness of transparent specimens because of their non-contact, full-field, and high-precision advantages[1–5]. In addition, several non-destructive measurement systems have been used to reconstruct the 3D shape of transparent objects[6–8]. Various interferometric methods have been presented to determine the parameters because the accuracies are not affected by the small loss in the sample[9–12]. To simplify the process, improve the experimental efficiency, and reduce the cost of the measurement, some approaches have been developed to measure the characteristics simultaneously[13,14]. However, most methods are not suitable for uneven surfaces or samples with a spatially non-uniform thickness. In recent years, the multi-frequency-based method has proved to be a good technique for the 3D profile measurement of objects with large curvatures and discontinuities[15–18]. In this Letter, a novel multi-frequency phase-shift lateral shear interferometer (LSI) system is proposed to measure the 3D shape and thickness of transparent objects simultaneously. By building a relationship between the in-plane displacement and their characteristics, the thickness and 3D shape can be reconstructed simultaneously.
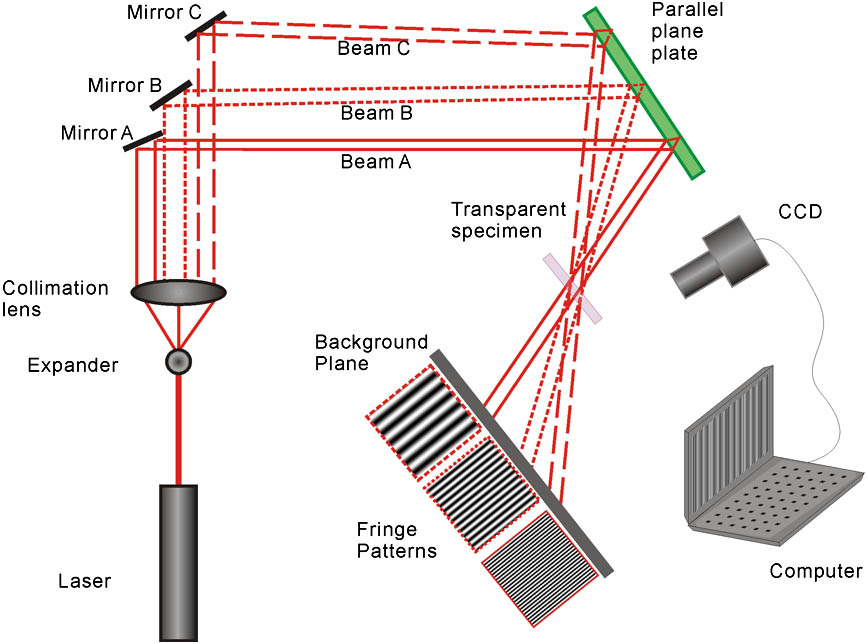
A schematic of the multi-frequency LSI system is shown in Fig. 1. The light beam emanating from a laser is expanded by an expander and then collimated by a collimation lens. Three tilted mirrors, Mirrors A, B, and C, are placed in the path of the collimated light. In order to generate multi-frequency fringe patterns, the three mirrors are tilted with different angles of inclination. The reflected beams, Beams A, B, and C, are then incident on a plane-parallel plate (PPP) and are sheared laterally because the incidence is not normal to the plate. Lateral shearing fringes are thus formed on the background plane. The fringes would be modulated after transmitting through a transparent specimen. A CCD camera is used to capture the interferograms. Because the same area of the specimen is illuminated by two reflective beams from different directions, the multi-frequency fringes can be recorded in one image.
The spatial frequency of a fringe pattern can be expressed as[19]where is an integer, which indicates the number of fringes. The shear amount can be expressed as where is the thickness of the PPP, is the refractive index, and is the angle of incidence.
Sign up for Chinese Optics Letters TOC. Get the latest issue of Chinese Optics Letters delivered right to you!Sign up now
Figure 2 presents the original fringes and their spectra. The original fringes with three different frequencies were recorded by a single camera, as shown in Fig. 2(a). The pair of fringes was divided into three parts for phase calculation. Figures 2(b)–2(d) display the set of cropped images, and the corresponding Fourier spectra are presented in Figs. 2(e) and 2(g). Due to the noise effect, the ratio of the two adjacent fringe frequencies should not be too large. To our knowledge, a ratio ranging from 2 to 5 is a good choice to achieve reliable results. The periods of the fringe patterns shown from left to right are 15, 7.5, and 3 pixels/fringe, respectively. The patterns are called high-frequency, mid-frequency, and low-frequency fringe patterns in the study. It can be seen that the three fringes have different spatial frequencies. Therefore, it can be noted that the desired spatial-carrier frequency of fringes can be obtained by this method. In addition, one can further increase the frequency by simply changing the angle of incidence.
Figure 2.Original fringes and their spectra: (a) Image with three different frequency fringes; (b) high-frequency fringe; (c) mid-frequency fringe; (d) low-frequency fringe; (e)–(g) spectra corresponding to (b)–(d), respectively.
To eliminate the phase ambiguity of the area with large curvature or discontinuities, a multi-frequency phase unwrapping algorithm was used, which can be expressed as where the subscript indicates the th frequency fringe, is the relative frequency of the fringes, denotes rounding to the nearest integer, and the superscripts and represent the unwrapped and wrapped phases, respectively.
The wrapped phase can be obtained from the Carré algorithm[20]: where is the interferogram intensity corresponding to each phase step, and the phase-shift quantity can be easily generated only by moving the PPP along an in-plane parallel direction[21].
The curvature angle, which is the angle between the tangent line at a given point and the horizontal straight line, can be used to describe the shape of an object. It is also the same as the angle between the normal vectors of the two lines.
Figure 3 illustrates the geometry of the beam path. The incident light is directed on the background plane without passing through transparent specimens, and the light is deflected when a testing transparent specimen is put in front of the background plane. Path is the ray that travels from the incident point to the background point with two refractions. When the specimen deforms, the incident point changes from to , and the traveling path changes from to .
Based on the law of refraction, where is the refractive index, represents the curvature angle, is the angle between the incident ray and the background plane, and is the thickness of the specimen after deformation.
Equation (5) contains two unknowns, namely, and , requiring a minimum of two fringe patterns to perform the measurement. If the specimen was illuminated by another light ray from a different direction, where is the angle between the other incident ray and the background plane, and is the in-plane displacement corresponding to the second incident ray.
Clearly, the curvature angle and thickness can be calculated from Eqs. (5) and (6). In this study, the angles and were set to be 45° and 30°, respectively. It is assumed that the changes of the refractive index are negligible due to shearing forces. Dividing Eq. (5) by Eq. (6) after substituting , , and into these two equations, we can obtain where , and and are the unwrapped phases corresponding to and , respectively.
The thickness can also be calculated by
Then, the height distribution can be obtained by
According to the principle of the proposed method, a 3D shape measurement was performed. The experiment was conducted on a thin transparent film with a thickness of 1 mm and a refractive index of . The specimen was fixed on a micro-displacement work stage, which can provide a shift in the and axes with an accuracy of 0.2 μm. A red He–Ne laser with a wavelength of 632.8 nm was used as the laser source. A CCD camera (UI-1540LE-M-GL, IDS Co., Ltd, Germany) with a resolution of at 256 gray levels was applied to capture the image.
Figure 4 illustrates the results and main analysis procedure. Four equal-step phase-shift frames with three different frequencies of deformed specimens were first recorded by one CCD camera simultaneously, followed by the division of the multi-frequency fringes. Figures 4(a-1) and 4(b-1) present the mid-frequency and low-frequency fringe patterns, respectively. Then, the corresponding wrapped phases can be extracted from Eq. (4), as shown in Figs. 4(a-2) and 4(b-2). To obtain the orientation modulo , an unwrapping process was performed based on the quality-guided path-following algorithm. Figure 4(a-3) presents the unwrapped phase of the mid-frequency fringes. Using the multi-frequency phase unwrapping algorithm given in Eq. (3), the unwrapped phase distributions of the mid-frequency fringes can be readily computed irrespective of the complexity of the fringe patterns. Figure 4(c) presents the unwrapped mid-frequency phase after ambiguity elimination. Similarly, the eliminated unwrapped high-frequency phase can also be obtained, as given in Fig. 4(d).
To retrieve the shape distributions due to shearing deformation, a curvature angle calculation is required. The absolute curvature angle computed from Eq. (7) is given in Fig. 4(e). The thickness can also be obtained based on Eq. (8). Because the thickness change caused by the shearing force is much smaller than the thickness, the thicknesses are very close to each other for the thin film before and after deformation. We just give the thickness change distribution, as presented in Fig. 5. Then, the height distribution can be computed from Eq. (9). The reconstructed 3D shape of the thin film under a shearing force is illustrated in Fig. 6.
The proposed system is simple, compact, and can produce highly stable real sinusoidal fringe patterns during testing. The main advantage of the multi-frequency LSI system is that it provides an appropriate and more accurate phase unwrapping mechanism for objects with large curvatures and discontinuities. Moreover, by illumination from different directions, 3D shape/deformation profiles can be obtained with a single camera. It should be noted that the 3D deformation/shape measurement is based on the hypothesis that the change of the refractive index is negligible due to forces. Further work on the dynamic measurement of the surface shape and thickness can be expected.