• Journal of Geographical Sciences
  • Vol. 30, Issue 7, 1140 (2020)
Le YIN1、3, Erfu DAI2、3、*, Du ZHENG1、3, Yahui WANG2、3, Liang MA2、3, and Miao TONG2、3
Author Affiliations
  • 1Key Laboratory of Land Surface Pattern and Simulation, Institute of Geographic Sciences and Natural Resources Research, Chinese Academy of Sciences, Beijing 100101, China
  • 2Lhasa Plateau Ecosystem Research Station, Key Laboratory of Ecosystem Network Observation and Modeling, Institute of Geographic Sciences and Natural Resources Research, CAS, Beijing 100101, China
  • 3University of Chinese Academy of Sciences, Beijing 100049, China
  • show less
    DOI: 10.1007/s11442-020-1774-z Cite this Article
    Le YIN, Erfu DAI, Du ZHENG, Yahui WANG, Liang MA, Miao TONG. Spatio-temporal analysis of the human footprint in the Hengduan Mountain region: Assessing the effectiveness of nature reserves in reducing human impacts[J]. Journal of Geographical Sciences, 2020, 30(7): 1140 Copy Citation Text show less

    Abstract

    Mapping the human footprint (HF) makes it possible to quantify human influence, which has had an unprecedented impact on the global ecosystem. Using five categories of human pressure data, this study mapped the HF of the Hengduan Mountain region and assessed the effectiveness of nature reserves in reducing human impacts. The results showed that the HF of the Hengduan Mountain region was generally higher in the south and lower in the north. The HF increased by 11.24% over the past 25 years, with faster growth in the southeast. The HF growth rate in nature reserves was much lower than that across the region, which indicated that nature reserves played an important role in reducing the impact of human pressure. A study of Baimaxueshan nature reserve found that establishing nature reserves could effectively reduce the impact of human activities, and no “leakage” occurred. Population growth was an important reason for the increased HF in nature reserves. The development of ecotourism in nature reserves must be based on ecological protection. Strengthening the long-term monitoring, evaluation, and management of nature reserves is a basic requirement for their long-term development.

    1 Introduction

    Human activities have caused unprecedented changes to global ecosystems (Halpern et al., 2008). The magnitude, variety, and scale of human-induced changes, including land use transformation and changes in atmospheric composition, have led to a series of problems such as loss of biodiversity (Young et al., 2005), reduced ecosystem services (Zheng et al., 2003, Carpenter et al., 2009), and degradation of natural habitats (Hooftman and Bullock, 2012). Some researchers have even suggested that mankind has entered a new geological epoch, termed the Anthropocene (Crutzen, 2002). Because human activities play an increasingly important role in ecosystem evolution, understanding the spatial and temporal patterns of human influence on the environment provides a basis for mitigating environmental damage in sensitive or ecologically valuable areas (Burton et al., 2014; Xu et al., 2016). Sanderson et al. (2002) first proposed and mapped the global human footprint (HF) based on five categories of data from the early 1990s: land transformation, population density, grazing density, human access, and electrical power infrastructure. This provided a new way to understand the human impact on the natural environment. Venter et al. (2016) updated the 2009 global HF, making it possible to quantify patterns of human impacts that change over time. As a tool to quantify the human impact on nature, HF is often used to assess the effectiveness of regional ecosystem protection efforts (Li et al., 2018; Tapia-Armijos et al., 2017). However, mapping human impacts on a global scale is limited by data accuracy and resolution, as well as our limited knowledge of the geographic characteristics of particular areas (Doney, 2010; Woolmer et al., 2008). Given the obvious heterogeneity of human activities in mountainous areas, more detailed datasets are needed when HF is used to understand local patterns. For example, Woolmer et al. (2008) mapped HFs with a 90 m resolution in the northern Appalachian/Acadian ecoregion using human settlements, access, land use changes, and electrical power infrastructure, and the results showed that regional scale HF mapping can support ecological conservation. Tapia-Armijos et al. (2016) found that the establishment of nature reserves effectively reduced the human impact in Podocarpus National Park, the most important protected area in South Ecuador, and that HF was a useful regional assessment tool to promote conservation planning.

    The Hengduan Mountain region is a very important ecological function area that integrates water supply, soil conservation, and species resource protection in China (http://www.mee.gov.cn/gkml/sthjbgw/qt/200910/t20091023_180123.htm). Due to the extremely fragile natural environment and unsustainable human activities, soil and water loss has intensified and regional biodiversity has decreased sharply since the early 1990s (Rao et al., 2016; Zhao and Gong, 2015). Establishing nature reserves is one effective way to reduce the negative effects of human activities and protect regional biodiversity (Ren et al., 2015; Zhu et al., 2018). Only a few studies have attempted a quantitative characterization of human activities in the Hengduan Mountain region (Shi et al., 2018). It remains unclear whether establishing nature reserves is effective in reducing human impact (Zhao et al., 2013; Wu et al., 2018). The objectives of this study were to: 1) map the HF in the Hengduan Mountain region and analyze their spatial and temporal characteristics from 1990 to 2015; 2) identify the spatial relationship between the HF and nature reserves; and 3) assess the effectiveness of nature reserves in reducing human impacts.

    2 Materials and methods

    2.1 Study site

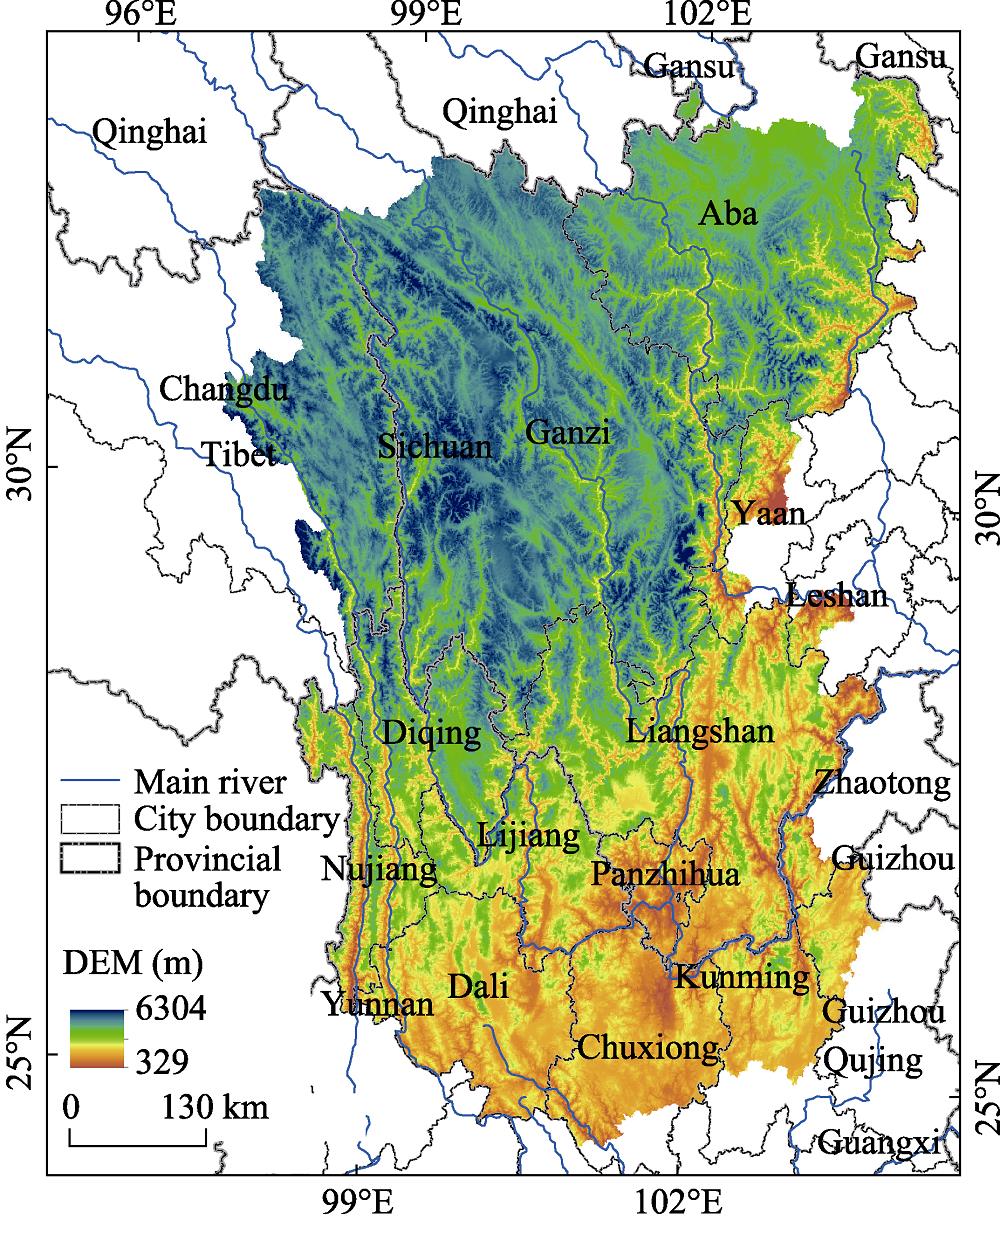
    The Hengduan Mountain region refers to a group of mountains that runs from north to south in southwest China. The area covered includes the western part of Sichuan Province, the northern part of Yunnan Province, and the eastern part of the Tibet Autonomous Region (Zheng and Yang, 1987). This region lies between 24°29'-33°43'N and 97°10'-104°25'E, and the total area is about 450,000 km2. The elevation ranges from 329 to 6304 m. By the end of 2015, there were 24 national nature reserves established in the region, covering an area of 28988.52 km2 and accounting for about 6.50% of the total area. This was done primarily to protect wildlife, forest ecosystems, and wetlands in the Hengduan Mountain region (Figure 1).

    Location of the Hengduan Mountain region

    Figure 1.Location of the Hengduan Mountain region

    2.2 Data and HF mapping methods

    Referring to the methods used to compile global HF datasets (Sanderson et al., 2002; Venter et al., 2016), we integrated land transformation, population density, grazing density, human access, and electrical power infrastructure data to map the HF in the Hengduan Mountain region (Table 1). It should be noted that when human pressure data was missing, data from a similar year was used to replace it in this study.

    Dataset typeDataset nameDataset formatResolutionTimingYearSource
    Land transformationLand useshp/tif1 kmDynamic1990/2000/2010/2015Data Center for Resources and Environmental Sciences, Chinese Academy of Sciences (RESDC) (http://www.resdc.cn)
    Population densityPopulation densitytif1 kmDynamic1990/2000/2010/2015Data Center for Resources and Environmental Sciences, Chinese Academy of Sciences (http://www.resdc.cn)
    Grazing densityNumber of cattle and sheepxls-Dynamic1990/2000/2010/2015Statistical Yearbook(http://data.cnki.net/yearbook)
    Human accessRoads and railwaysshp1 kmDynamic2000/2009/2016Geographic Data Sharing Infrastructure, College of Urban and Environmental Science, Peking University (http://geodata.pku.edu.cn)
    Electrical power infrastructureNighttimelightstif1 kmDynamic1992/2000/2010/2013National Oceanic and Atmospheric Administration(https://ngdc.noaa.gov/eog/download.html)

    Table 1.

    Datasets collected to map the human footprint (HF)

    2.2.1 Land transformation

    Land is the carrier of human influence on natural ecosystems. Different land uses cause different ecosystem process changes and have a range of effects on the natural environment. Land transformation is not only a direct representation of human activities, but also an important cause of biodiversity reduction and degradation of the natural environment (Foley et al., 2005). Different land use types lead to differences in the magnitude of human pressure on the natural environment.

    Using the National Land Resource Classification System from the Chinese Academy of Sciences, we assigned pressure scores to different land use types. Built-up land represents human-produced areas that provide a setting for human activity, and we assigned a score of 10 to urban land, factories, mining, transportation facilities, and airports. We then assigned a score of 8 to rural residential land, reservoirs, and ponds. Due to the relatively extensive mode of crop production in mountainous areas, we assigned cropland a score of 7, i.e., lower than that for built-up land. Because the Hengduan Mountain region is affected by forest harvesting and the implementation of ecological restoration projects, rather than assigning a score of 0 to woodland, as is the case in the global HF datasets, we used a value of 3. We also assigned value of 2 and 1 to dense and moderate grasslands with grazing potential, respectively. All other land use types were assigned a score of 0.

    2.2.2 Population density

    The higher the population density, the greater the demand for ecosystem resources and the larger the human impact on the ecosystem (Luck et al., 2003). The human population density was mapped using 1 km Chinese population datasets for 1990, 2000, 2010, and 2015. Based on the assignment method used in global HF datasets, we assigned a score of 10 to locations with a density greater than 1000 people/km2 (Venter et al., 2016). For other locations, we assigned influence scores according to the population density in each pixel. The scores for densities in the range of 0-1000 people/km2 increased linearly from 0 to 10.

    2.2.3 Grazing density

    Grazing is widespread throughout alpine areas, has a significant impact on vegetation, and is generally considered a human pressure on natural ecosystems (Sherman et al., 2008). Because grazing intensity raster data were not available for the Hengduan Mountain region, county level cattle and sheep numbers were used to represent grazing intensity. According to the principle of one cattle equals five sheep, grazing intensity was expressed in sheep units. Because county level cattle and sheep numbers for 1990 were unavailable from a statistical yearbook, we performed a linear extrapolation based on 2000, 2010, and 2015 data. We then normalized the grazing intensity data and assigned scores ranging from 0 to 10 (Li et al., 2018) using equation (1).

    $\text{Grazing}\ \text{density}\left( i,t \right)=ROUND\left[ \frac{\text{Number}\left( i,t \right)}{MAX\left( \text{Number}\left( i,t \right) \right)} \right]\times 10$

    where Grazing density (i, t) is the grazing density score of grid i in year t, and Number (i, t) is the number of sheep in grid i in year t.

    2.2.4 Human access

    Roads enable human access to nature and are considered to be the main cause of declining natural habitat quality and quantity (Geneletti, 2003; Lee et al., 2012). Due to the availability of data, we used road data for 2000, 2009, and 2016 to replace road data for 1990, 2010, and 2015, respectively. A Euclidean distance analysis was conducted for each road type using ArcGIS 10.2, and then we assigned scores in the range of 0 to 10 according to distance from the road (Table 2). If a location was crossed by multiple roads, the maximum value of the grid was taken as the final score. It should be noted that although the Hengduan Mountain region has a well-developed water system, there are presently no navigable waterways due to the large elevation changes throughout the area. Therefore, unlike in the global HF, rivers were not considered in this study.

    Type0-1 km1-4 km4-7 km7-10 km10-15 km
    Expressway108642
    National-level highway108531
    Provincial-level highway86420
    County-level highway64210
    Rural-level highway42100
    Railway109752

    Table 2.

    Human access scores for roads

    2.2.5 Electrical power infrastructure

    Nighttime light datasets, which indicate the level of regional development, provide a means of mapping regional power infrastructure conditions (Nordhaus and Chen, 2014). The National Oceanic and Atmospheric Administration (NOAA) provides global nighttime light data, with a resolution of 1 km, from 1992 to 2013. In this study, we used 1992, 2000, 2010, and 2013 nighttime light data to represent the Hengduan Mountain region electrical power infrastructure in the years 1990, 2000, 2010, and 2015. We normalized the four periods of nighttime light data and assigned scores of 0 to 10 (Venter et al., 2016).

    2.2.6 Summation of human pressure scores

    The assigned scores for each human pressure category ranged from 0 to 10, and a summation of the assigned scores was conducted using equation (2). The land transformation, population density, grazing density, human access, and electrical power infrastructure scores were summed up to map the HF.

    $\begin{align} & HF\ (i,t)=\text{land}\ \text{transformation}\ (i,t)+\text{population}\ \text{density}\ (i,t)+\text{grazing}\ \text{density}\ (i,t)+ \\ & \ \ \ \ \ \ \ \ \ \ \ \ \ \ \ \text{human}\ \text{access}\ (i,t)+\text{electrical}\ \text{power}\ \text{infrastructure}\ (i,t) \\ \end{align}$

    where HF(i,t) is the HF of grid i in year t, grazing density (i,t), human access (i,t), population density (i,t), electrical power infrastructure (i,t), and land transformation (i,t), are the intensities of grazing, road, population, electricity infrastructure, and land use, respectively.

    Using the Jenks natural breaks method, we reclassified the HF of the Hengduan Mountain region into six classes: no influence (HF = 0), slight influence (HF = 1-6), low influence (HF = 7-12), moderate influence (HF = 13-17), high influence (HF = 18-23), and extremely high influence (HF = 24-49).

    2.2.7 Human footprint trend analysis

    To understand the characteristics of HF changes in the Hengduan Mountain region, we calculated the trend using equation (3).

    $\frac{\Delta y}{\Delta x}=\frac{{{y}_{2}}-{{y}_{1}}}{{{x}_{2}}-{{x}_{1}}}$

    where$\frac{\Delta y}{\Delta x}$ is the HF rate of the change from x1 to x2, and y1 and y2 are the HF in years x1 and x2, respectively. When $\frac{\Delta y}{\Delta x}>0$, the trend towards human pressure on nature is increasing.

    2.3 Relationship between the HF and nature reserves

    The dynamic characteristics of the human influence on nature require managers and planners to consider the explicit spatial variations of threats, as well as the fact that threats (such as roads and population) are not uniformly distributed throughout the landscape. There is a close relationship between human activities and natural ecosystems, and high-intensity human activities tend to aggravate the loss of biodiversity (Vitousek et al., 1997; Boivin et al., 2016).

    A nature reserve is an area designated by law for special protection and the management of natural ecosystems, rare species, and natural relics, which is achieved in part by reducing or preventing the impacts of human pressure (Wu et al., 2011). China established its first nature reserve in 1956 (Dinghushan Nature Reserve), and a further 2,740 nature reserves had been established at the national, provincial, municipal, and county levels by the end of 2015, accounting for about 14.83% of China's total land area (http://www.gov.cn/guoqing/2019-04/09/content_5380702.htm). Although the number of nature reserves in China is increasing rapidly, their quality is limited because of a lack of scientific planning and they are often created as emergency measures to protect endangered species (Li et al., 2018; Zhang et al., 2017).

    The HF is a tool that maps the spatial dimensions of human influence, showing the extent and intensity of human presence and behavior, and making it possible to quantify the impact of human activity. The relationship between nature reserves and the HF is still unclear. After the establishment of nature reserves, human activity is restricted or prohibited by law, while areas without nature reserves will experience an increase in human activity. Therefore, we used a spatial overlap analysis to analyze the relationship between HF and nature reserves.

    2.4 Assessing the effectiveness of nature reserves in mitigating human impacts

    The effectiveness of a nature reserve requires not only that the human pressure inside the protected area is stable or reduced, but also that the human pressure is not transferred to adjacent areas via a phenomenon called “leakage” (Ewers and Rodrigues, 2008). Therefore, we established three equally-sized buffer zones outside the reserve, and randomly selected six equally-sized sample zones within the buffer zones. No other reserves were located in the buffer zones, preventing any impact on the study reserve. The effectiveness of the nature reserve was determined by comparing the mean HF of the sample zones, buffer zones, and interior of the reserve (Figure 2). When the difference between the HF of the sample zones and nature reserves was greater than the difference between the HF scores of the sample and buffer zones, the reserve could significantly reduce the impacts of human activities. When the HF in the buffer zones was greater than that in the sample zones, leakage occurred.

    The conceptual model to assess the effectiveness of nature reserves in the Hengduan Mountain region

    Figure 2.The conceptual model to assess the effectiveness of nature reserves in the Hengduan Mountain region

    The period covered by this study was from 1990 to 2015, but most nature reserves in the Hengduan Mountain region were not established until after 1990. The comparison of HF changes in nature reserves did not fully reflect the management impact of each nature reserve, because no protective measures were taken from 1990 to the year when the nature reserve was established. In this study, we selected seven nature reserves in the Hengduan Mountain region that were established before 1990 to assess their effectiveness: Baimaxueshan nature reserve (established in 1983), Cangshanerhai nature reserve (1981), Gaoligongshan nature reserve (1983), Wolong nature reserve (1963), Yaoshan nature reserve (1984), Yunlongtianchi nature reserve (1983), and Ailaoshan nature reserve (1986). However, the Wolong, Yaoshan, and Ailaoshan nature reserves are located close to the boundary of the Hengduan Mountain region and the Cangshanerhai, Gaoligongshan, and Yunlongtianchi nature reserves covered multiple polygons; thus, it was difficult to conduct a buffer analysis for these nature reserves. Therefore, the Baimaxueshan nature reserve was selected to investigate whether the influence of human activities in the nature reserve could be transferred to the surrounding areas.

    3 Results

    3.1 Spatial and temporal HF changes in the Hengduan Mountain region during 1990-2015

    The HF in the Hengduan Mountain region ranged from 0 to 49 between 1990 and 2015, and the mean HF scores in 1990, 2000, 2010, and 2015 were 10.59, 10.65, 11.52, and 11.78, respectively. The influence of human activities in the Hengduan Mountain region was relatively weak, with slight and low influence areas accounting for 34.42% and 30.58% of the total area, respectively, in 2015. The trend analysis indicated that the human influence on the natural environment increased during this period.

    The HF distribution displayed an obvious spatial heterogeneity. The HF was higher in the southern part of the Hengduan Mountain region than in the northern part, with high-value areas distributed primarily in low-lying areas with dense populations and well-developed traffic, such as the areas near the river valleys (Figure 3a). In addition, compared to 1990-2000 and 2010-2015, the HF in the Hengduan Mountain region changed substantially during 2000-2010, with most areas exhibiting increasing trends (Figure 3b).

    Human footprint (HF) in 1990, 2000, 2010, and 2015 (a); HF changing trends between 1990 and 2015 (b) in the Hengduan Mountain region

    Figure 3.Human footprint (HF) in 1990, 2000, 2010, and 2015 (a); HF changing trends between 1990 and 2015 (b) in the Hengduan Mountain region

    3.2 Differences in the HF among nature reserves

    There were significant differences in HF among the different nature reserves. Generally, the proportion of slight and low influence classes in the nature reserves accounted for 58.78% and 26.44% of the total nature reserve area in 2015, respectively (Figure 4). This indicates that human activity was relatively weak in the nature reserves of the Hengduan Mountain region. However, the intensity of human activities in the different nature reserves varied substantially (Table 3). In 2015, the mean HF scores in the Gaoligongshan and Jiuzhaigou nature reserves were 3.91 and 4.07, respectively, while the scores in the Huize Black-necked Crane nature reserve and Panzhihua Cycas nature reserve were 23.35 and 28.21, respectively. Among the 24 nature reserves, seven had higher HF scores than the mean in the Hengduan Mountain region, which may be related to the ongoing conflict between local human activities and ecological conservation (Zhang and Jiang, 2004).

    Changes in the human footprint (HF) in the Hengduan Mountain region from 1990 to 2015

    Figure 4.Changes in the human footprint (HF) in the Hengduan Mountain region from 1990 to 2015

    CodeNameArea (km2)HFCodeNameArea (km2)HF
    1990201519902015
    1Baimaxueshan2795.685.886.2314Yading1463.786.667.02
    2Cangshanerhai819.3210.5014.0615Mangkang Yunnan Golden Monkey1891.439.4211.04
    3Gaoligongshan3243.303.313.9116Ailaoshan174.8511.2112.49
    4Sanjiangyuan2029.3110.5110.5417Wuliangshan77.9410.8112.94
    5Chaqingsongduo1428.816.225.3218Yaoshan203.8313.5714.67
    6Fengtongzhai308.748.658.6719Gexigou516.5710.0810.07
    7Gonggashan4040.644.234.1520Heizhugou290.768.016.22
    8Haizishan4575.207.245.7521Jiaozishan161.876.488.15
    9Jiuzhaigou652.464.074.0722Yunlongtianchi141.887.619.68
    10Meigu Dafengding495.5910.1512.7823Huize Black-necked Crane131.8915.4423.35
    11Panzhihua Cycad13.9917.6428.2124Liziping477.608.119.46
    12Siguniangshan569.537.157.28All nature reserves28988.526.756.87
    13Wolong2075.286.465.87Hengduan Mountain region450000.0010.5911.78

    Table 3.

    The human footprint (HF) in the 24 nature reserves of the Hengduan Mountain region

    3.3 Effectiveness of nature reserves in reducing human impact

    From 1990 to 2015, the HF in the nature reserves increased by 0.12, while the HF in the whole Hengduan Mountain region increased by 1.19. This indicates that the establishment of nature reserves can effectively reduce the impact of human activities on the natural environment. Among the seven nature reserves established before 1990, except for Cangshanerhai and Yunlongtianchi, the HF changes were relatively small and the HF growth areas were mainly distributed in the marginal areas of nature reserves from 1990 to 2015 (Figure 5).

    Changes in the human footprint (HF) in various nature reserves of the Hengduan Mountain region during 1990-2015

    Figure 5.Changes in the human footprint (HF) in various nature reserves of the Hengduan Mountain region during 1990-2015

    This study also conducted a comparative analysis of the HF changing trends among the sample zones, buffer zones, and inside the Baimaxueshan nature reserve. In 1990 and 2015, the HF scores inside Baimaxueshan nature reserve were 5.80 and 6.19, the buffer zone HF scores were 6.71 and 7.28, and the sample zone HF scores were 6.99 and 8.17. It can be seen that the further away from the nature reserve, the higher the HF scores. From 1990 to 2015, the inside Baimaxueshan nature reserve, buffer zone, and sample zone HF scores increased by 0.39, 0.57, and 1.18, respectively. For the three buffer zones, the HF scores increased by 0.19. Thus, the growth rate of HF in the sample zones was much faster than that in the nature reserve and the buffer zones. Therefore, the Baimaxueshan nature reserve reduced the impact of human activities significantly, and no leakage occurred.

    3.4 Reasons for changes in the HF in nature reserves between 1990 and 2015

    Imbalances in the changes in the HF were closely related to changes in the five categories of human pressure (Figure 6). From 1990 to 2015, land use pressure changes were relatively small, population pressure growth areas were mainly distributed in the south, the grazing intensity pressure increased faster in the southeast, the regional distribution of stress due to increased human access was relatively well dispersed, and areas with increased power infrastructure pressure were located mostly around cities.

    Changes in human pressure in the Hengduan Mountain region from 1990 to 2015

    Figure 6.Changes in human pressure in the Hengduan Mountain region from 1990 to 2015

    The driving factors of HF changes in the different nature reserves were also different (Figure 7). In Baimaxueshan nature reserve, grazing intensity and population density were the main reasons for the increased HF. The two factors increased by 22.00% and 12.28%, respectively. In Cangshanerhai nature reserve, the HF increased mainly due to increased electrical power infrastructure, grazing intensity, and population density pressures. Grazing intensity and human access were the main driving forces of the increased HF in the Gaoligongshan nature reserve. For Wolong nature reserve, increased population density was the main reason for the increased HF over the past 25 years, while the decreased HF between 1990 and 2000 was due to the sharp decline in grazing intensity. The increased HF in Yaoshan nature reserve was mainly due to increases in grazing intensity and road construction. The increased HF in Yunlongtianchi nature reserve occurred mainly due to increases in grazing intensity and population density. Increasing population density and road construction were the main driving forces of the increased HF in Ailaoshan nature reserve. Thus, population growth, grazing, and infrastructure construction were the main reasons for the increased HF in the Hengduan Mountain region nature reserves (Xu and Wilkes, 2004; Xu et al., 2012).

    The variation of the main human influences within nature reserves of the Hengduan Mountain region

    Figure 7.The variation of the main human influences within nature reserves of the Hengduan Mountain region

    4 Discussion

    Although an increasing number of nature reserves are being created in China, problems with their layout and management remain (Xu et al., 2012). Many nature reserves in the Hengduan Mountain region have been expanded from their original sizes, such as Baimaxueshan nature reserve and Yaoshan nature reserve. This indicates that for some nature reserves adequate scientific planning was not conducted at the time they were established, and therefore some core conservation objectives of the reserves were not met (Li et al., 2018; Zhang et al., 2017). Under the influence of road pressure, HF scores on both sides of roads were relatively high. However, some main roads pass directly through nature reserves in the Hengduan Mountain region. For example, provincial highway 217 passes directly through Haizishan nature reserve, indicating that the spatial layout of the nature reserve may be inappropriate from the perspective of the HF. The Cangshanerhai nature reserve is the only suburban nature reserve in Yunnan Province, and the increasing material needs of human beings pose a great threat to biodiversity in the reserve (Shen, 1998). In addition, for some nature reserves with high HF scores, such as Panzhihua Cycad nature reserve and Huize Black-necked Crane nature reserve, it will be necessary to conduct detailed field investigations and undertake timely effective measures to protect them.

    Ecotourism has emerged as a popular activity in recent years. Many nature reserve managers regard it as an opportunity for reserve management and development (Liu et al., 2013). However, there are still various problems with implementing ecotourism in nature reserves. Studies have shown that ecotourism in many nature reserves is indistinguishable from nature tourism, and only 16% of protected areas with tourism conducted regular environmental monitoring (Han and Ren, 2001). In addition, there have been problems due to weak scientific research and low investment in environmental protection in support of ecotourism development (Luo and Zheng, 2008). Due to differences in structure, management, and culture, ecotourism can be problematic in many places. This study found that the HF increased much faster in nature reserves with tourism value than in other nature reserves. From 1990 to 2015, the HF of the Cangshanerhai and Yunlongtianchi nature reserves increased by 25.87% and 28.72%, respectively. Population density pressure was an important reason for the increased HF. It is very important to strengthen the long-term monitoring, evaluation, and management of nature reserves to realize the sustainable development of nature reserves, while implementing ecotourism in nature reserves (Das and Chatterjee, 2015; Han and Ren, 2001).

    There are also some limitations in the determination of nature reserve effectiveness by mapping local HFs. First, although different types of data were used to describe the pressures of human activities on natural ecosystems, they did not cover all human pressures, such as human-induced environmental pollution and species invasion (Federico et al., 2007; Gallardo et al., 2015; Gonzálezabraham et al., 2015). Second, different human pressures have different impacts on ecosystems; hence, the selection of human activity factors and assignment of magnitude values to human pressures requires further assessment (Tapia-Armijos et al., 2017; Venter et al., 2016; Li et al., 2018). Third, there are data availability limitations. When human pressure data for a specific year was missing, this study used data from similar years instead. Future research should focus on improving HF accuracy using more detailed, higher-resolution data (Burton et al., 2014) and seek to establish relationships between the HF and ecological processes, ecosystem functions (Federico et al., 2007), ecosystem services (Vörösmarty et al., 2010), and human well-being (Dietz et al., 2009), to better guide human activities.

    5 Conclusions

    Based on land transformation, population density, grazing density, human access, and electrical power infrastructure data, this study mapped the HF of the Hengduan Mountain region and assessed the effectiveness of nature reserves in reducing human impacts. The main conclusions were as follows.

    (1) Although the impact of human activities was relatively weak in the Hengduan Mountain region, the HF score increased by 0.06 in the first decade and 1.13 in the last 15 years, indicating that the impact of human activities on the Hengduan Mountain region increased rapidly.

    (2) The mean HF in the nature reserves was much lower than that in the Hengduan Mountain region. However, the mean HF in seven nature reserves (especially in Panzhihua Cycad nature reserve and Huize Black-necked Crane nature reserve) was higher than that in the study area. Managers should pay more attention to the balance between the development and ecological protection of these nature reserves.

    (3) Nature reserves played a clear role in reducing the influence of human pressure. An analysis of Baimaxueshan nature reserve found that establishing nature reserves could effectively reduce the impacts of human activities and no leakage occurred.

    (4) Population growth was as important reason for the increased HF in nature reserves. The development of ecotourism in nature reserves must be based on protection of the local natural environment. Strengthening the long-term monitoring, evaluation, and management of nature reserves is a basic requirement for the long-term development of nature reserves.

    References

    [1] et alEcological consequences of human niche construction: Examining long-term anthropogenic shaping of global species distributions. Proceedings of the National Academy of Sciences, 113, 6388-6396(2016).

    [2] et alA framework for adaptive monitoring of the cumulative effects of human footprint on biodiversity. Environmental Monitoring and Assessment, 186, 3605-3617(2014).

    [3] et alScience for managing ecosystem services: Beyond the Millennium Ecosystem Assessment. Proceedings of the National Academy of Sciences, 106, 1305-1312(2009).

    [4] The Anthropocene: Geology of mankind. Nature, 415, 23-24(2002).

    [5] Ecotourism: A panacea or a predicament?. Tourism Management Perspectives, 14, 3-16(2015).

    [6] Environmentally efficient weil-being: Rethinking sustainability as the relationship between human well-being and environmental impacts. Human Ecology Review, 16, 114-123(2009).

    [7] The growing human footprint on coastal and open-ocean biogeochemistry. Science, 328, 1512-1516(2010).

    [8] Estimates of reserve effectiveness are confounded by leakage. Trends in Ecology & Evolution, 23, 113-116(2008).

    [9] et alThe human footprint in the carbon cycle of temperate and boreal forests. Nature, 447, 848-850(2007).

    [10] et alGlobal consequences of land use. Science, 309, 570-574(2005).

    [11] The importance of the human footprint in shaping the global distribution of terrestrial, freshwater and marine invaders. PloS One, 10, e0125801(2015).

    [12] Biodiversity impact assessment of roads: An approach based on ecosystem rarity. Environmental Impact Assessment Review, 23, 343-365(2003).

    [13] The human footprint in Mexico: Physical geography and historical legacies. PloS One, 10, e0128055(2015).

    [14] A global map of human impact on marine ecosystems. Science, 319, 948-952(2008).

    [15] Mapping to inform conservation: A case study of changes in semi-natural habitats and their connectivity over 70 years. Biological Conservation, 145, 30-38(2012).

    [16] Effects of roads on adjacent plant community composition and ecosystem function: An example from three calcareous ecosystems. Environmental Pollution, 163, 273-280(2012).

    [17] et alHuman footprint in Tibet: Assessing the spatial layout and effectiveness of nature reserves. Science of Total Environment, 621, 18-29(2018).

    [18] Current trends of ecotourism in China’s nature reserves: A review of the Chinese literature. Tourism Management Perspectives, 7, 16-24(2013).

    [19] Population diversity and ecosystem services. Trends in Ecology & Evolution, 18, 331-336(2003).

    [20] Ecotourism in nature reserves in China: Current situation, problems and solutions. Forest Ecosystems, 10, 130-133(2008).

    [21] Ecotourism in China’s nature reserves: Opportunities and challenges. Journal of Sustainable Tourism, 9, 228-242(2001).

    [22] A sharper image? Estimates of the precision of nighttime lights as a proxy for economic statistics. Journal of Economic Geography, 15, 217-246(2014).

    [23] et alChanges in ecosystem service of soil conservation between 2000 and 2010 and its driving factors in southwestern China. Chinese Geographical Science, 26, 165-173(2016).

    [24] et alEffectiveness of China’s national forest protection program and nature reserves. Conservation Biology, 29, 1368-1377(2015).

    [25] et alThe human footprint and the last of the wild. Bioscience, 52, 891-904(2002).

    [26] The ecological footprint: A non-monetary metric of human consumption applied to North America. Global Environmental Change, 13, 83-100(2003).

    [27] Studies on the resource exploitation and biodiversity conservation in Dali Cangshan-Erhai Nature Reserve. Chinese Biodiversity, 6, 151-156(1998).

    [28] et alSpatial patterns of plant diversity and communities in alpine ecosystems of the Hengduan Mountains, northwest Yunnan, China. Journal of Plant Ecology, 1, 117-136(2008).

    [29] Spatio-temporal pattern changes of land space in Hengduan Mountains during 1990-2015. Journal of Geographical Sciences, 28, 529-542(2018).

    [30] Spatio-temporal analysis of the human footprint in South Ecuador: Influence of human pressure on ecosystems and effectiveness of protected areas. Applied Geography, 78, 22-32(2017).

    [31] et alSixteen years of change in the global terrestrial human footprint and implications for biodiversity conservation. Nature Communication, 7, 12558(2016).

    [32] et alHuman domination of Earth’s ecosystems. Science, 277, 494-499(1997).

    [33] et alGlobal threats to human water security and river biodiversity. Nature, 467, 555-561(2010).

    [34] et alRescaling the Human Footprint: A tool for conservation planning at an ecoregional scale. Landscape and Urban Planning, 87, 42-53(2008).

    [35] Spatial distribution of nature reserves in China: Driving forces in the past and conservation challenges in the future. Land Use Policy, 77, 31-42(2018).

    [36] et alEffectiveness of China’s nature reserves in representing ecological diversity. Frontiers in Ecology and the Environment, 9, 383-389(2011).

    [37] et alA review and assessment of nature reserve policy in China: Advances, challenges and opportunities. Oryx, 46, 554-562(2012).

    [38] Biodiversity impact analysis in northwest Yunnan, southwest China. Biodiversity & Conservation, 13, 959-983(2004).

    [39] et alTowards sustainable land use: Identifying and managing the conflicts between human activities and biodiversity conservation in Europe. Biodiversity and Conservation, 14, 1641-1661(2005).

    [40] Analysis to ec-ecological contradiction of nature reserves. Problems of Forestry Economics, 24, 306-308(2004).

    [41] et alBiodiversity conservation status in China’s growing protected areas. Biological Conservation, 210, 89-100(2017).

    [42] et alDistribution of terrestrial national nature reserves in relation to human activities and natural environments in China. Biodiversity Science, 21, 658-665(2013).

    [43] Diversity and conservation of plant species in dry valleys, southwest China. Biodiversity and Conservation, 24, 2611-2623(2015).

    [44] Some problems of natural regionalization in Hengduan mountain area. Mountain Research, 5, 7-13(1987).

    [45] et alThe impact of human activities on ecosystem services. Journal of Natural Resources, 18, 118-126(2003).

    [46] et alDynamic changes of habitats in China’s typical national nature reserves on spatial and temporal scales. Journal of Geographical Sciences, 28, 778-790(2018).

    Le YIN, Erfu DAI, Du ZHENG, Yahui WANG, Liang MA, Miao TONG. Spatio-temporal analysis of the human footprint in the Hengduan Mountain region: Assessing the effectiveness of nature reserves in reducing human impacts[J]. Journal of Geographical Sciences, 2020, 30(7): 1140
    Download Citation