
Liangliang Mo, Jieji Ren, Mingjun Ren. Microlens Array-Based Spatial Angle Encoding for High-Precision Visual Pose Measurement[J]. Acta Optica Sinica, 2022, 42(16): 1612002
- Acta Optica Sinica
- Vol. 42, Issue 16, 1612002 (2022)
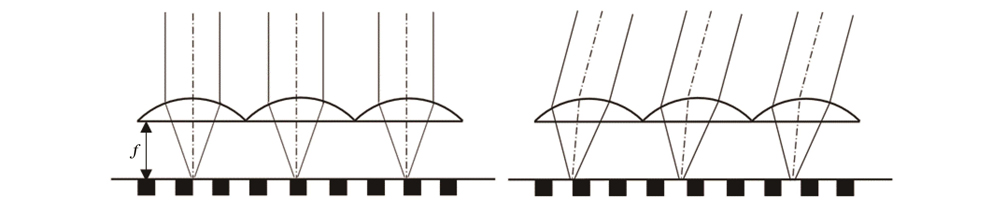
Fig. 1. Principle of dynamic display by microlens array
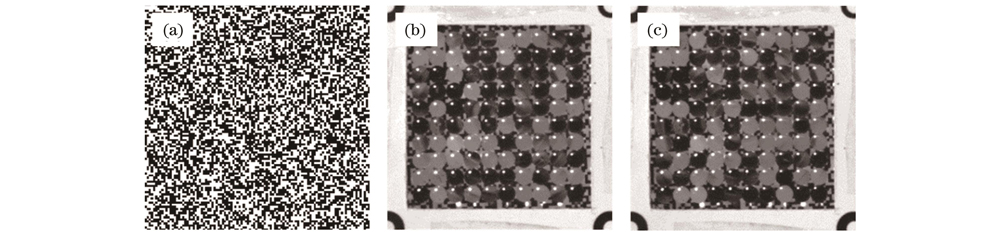
Fig. 2. Micrographics array and dynamic display effect. (a) Micrographics array; (b)(c) display patterns at different shooting angles (after perspective transformation)
Fig. 3. Weighted estimation of x-axis and y-axis rotation angles
Fig. 4. Experimental scene. (a) Experimental setup; (b) camera; (c) rotator and microlens array fiducial marker; (d) display of microlens array fiducial marker
Fig. 5. Schematic diagram of viewpoint variation range in angular vector space
Fig. 6. Display patterns at different shooting angles (after perspective transformation). (a)
Fig. 7. Pose measurement results. (a) x-axis rotation angle error; (b) y-axis rotation angle error; (c) z-axis rotation angle error; (d) estimation result of translation in x direction; (e) estimation result of translation in y direction; (f) estimation result of translation in z direction
|
Table 1. Comparison of average measurement error of rotation angle by different methods
|
Table 2. Comparison of average measurement error of rotation angle by OSTU method and maximum information entropy method
|
Table 3. Comparison of failure number of rotation angle measurement by two gray threshold segmentation methods
|
Table 4. Average measurement error of rotation angle under different threshold number
|
Table 5. Comparison of average measurement error of rotation angle by dense encoding method and linear interpolation method
|
Table 6. Average Hamming distance at different angle intervals

Set citation alerts for the article
Please enter your email address
© Copyright 2018-2021 | Chinese Laser Press. All Rights Reserved 沪ICP备15018463号-20