
Yupeng Zhang, Yongdong Wang, Gang Xu, Shulin Gong, Mingri Tang, Lei Wang. Effect of Graphene on Microstructure and Properties of Laser Cladding Ti-C-Nb-Reinforced Ni-Based Coating[J]. Laser & Optoelectronics Progress, 2022, 59(1): 0114002
- Laser & Optoelectronics Progress
- Vol. 59, Issue 1, 0114002 (2022)
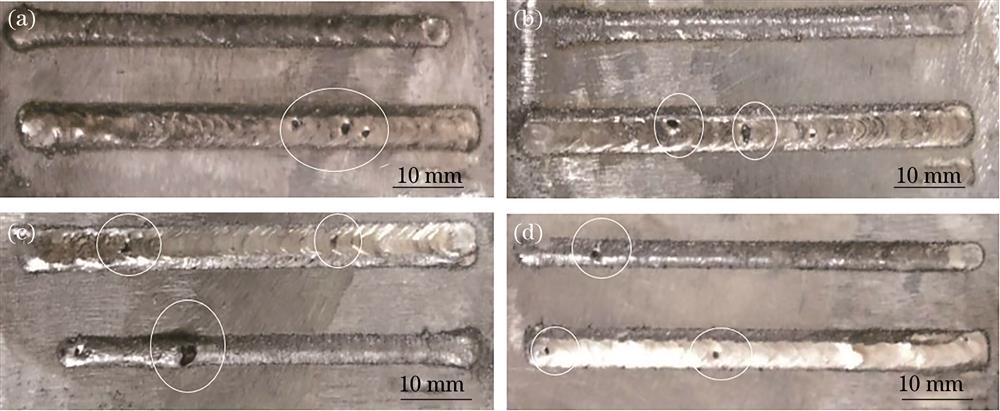
Fig. 1. Macro morphology of laser cladding coating. (a) Free graphene; (b) 1% graphene; (c) 2% graphene; (d) 3% graphene
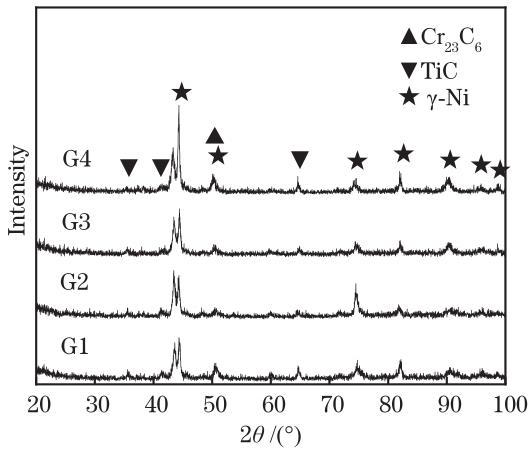
Fig. 2. X-ray diffraction pattern of the coating
Fig. 3. Position of energy spectrum analysis for coating. (a) Position 1; (b) position 2; (c) position 3
Fig. 4. BSE morphology of coating interface. (a) Free graphene; (b) 1% graphene; (c) 2% graphene; (d) 3% graphene
Fig. 5. Cross-sectional line scanning of coating
Fig. 6. BSE photo of Ti-C-Nb coating cross section. (a) Bottom part of coating; (b) middle part of coating; (c) top part of coating
Fig. 7. BSE ptoto of Ti-C-Nb graphene at bottom of Ti-C-Nb-graphene coating cross section. (a) 1% graphene;
Fig. 8. BSE photo of Ti-C-Nb-graphene at middle of coating cross section. (a) 1% graphene; (b) 2% graphene; (c) 3% graphene
Fig. 9. BSE photo of Ti-C-Nb-graphene at top of coating cross section. (a) 1% graphene; (b) 2% graphene; (c) 3% graphene
Fig. 10. TEM and electron diffraction pattern of white granular phase in 2% graphene cladding coating. (a) TEM morphology; (b) electron diffraction pattern
Fig. 11. Microhardness curve of Ti-C-Nb-graphene coating
|
Table 1. Chemical composition of Ni60A alloy powder
|
Table 2. Composition ratio of alloy powder (mass fraction)
|
Table 3. Chemical composition of different phases (mass fraction)
|
Table 4. Chemical composition of different phases (atomic fraction)
| ||||||||||||||||||||||||||||||||||||||||||||||||||||||||||||
Table 5. Microhardness test of Ti-C-Nb- graphene coating

Set citation alerts for the article
Please enter your email address
© Copyright 2018-2021 | Chinese Laser Press. All Rights Reserved 沪ICP备15018463号-20