• Chinese Optics Letters
  • Vol. 18, Issue 7, 070201 (2020)
Yuxin Sun, Yuan Yao*, Yaqin Hao, Hongfu Yu, Yanyi Jiang**, and Longsheng Ma
Author Affiliations
  • State Key Laboratory of Precision Spectroscopy, East China Normal University, Shanghai 200062, China
  • show less
    DOI: 10.3788/COL202018.070201 Cite this Article Set citation alerts
    Yuxin Sun, Yuan Yao, Yaqin Hao, Hongfu Yu, Yanyi Jiang, Longsheng Ma. Laser stabilizing to ytterbium clock transition with Rabi and Ramsey spectroscopy[J]. Chinese Optics Letters, 2020, 18(7): 070201 Copy Citation Text show less
    Simplified experimental setup for lattice trapping, clock transition probing, and laser frequency locking. AOM, acousto-optic modulator; PBS, polarizing beam splitter; PMT, photomultiplier tube; PD, photodetector; L, lens.
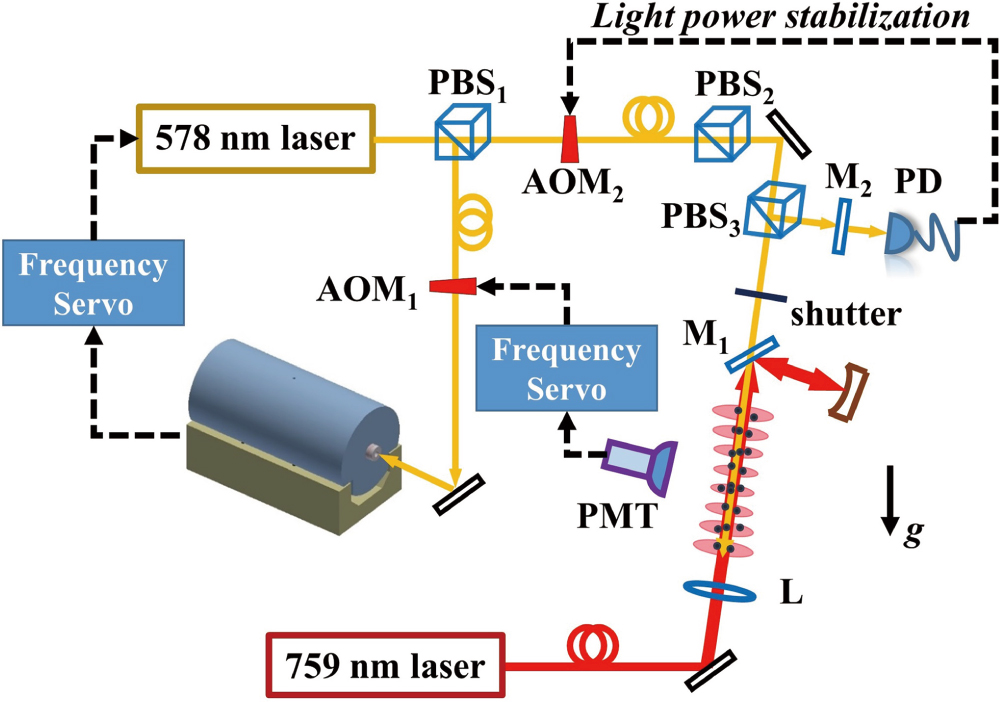
    Fig. 1. Simplified experimental setup for lattice trapping, clock transition probing, and laser frequency locking. AOM, acousto-optic modulator; PBS, polarizing beam splitter; PMT, photomultiplier tube; PD, photodetector; L, lens.
    (a) Atomic excitation rate as a function of probe time when the LO is resonant on the clock transition. The red line is a fit to the data. (b) Rabi spectrum of Yb clock transition (no averaging). The probe time is 200 ms (black dots) and 900 ms (blue squares in the inset). The solid lines are the fit to the data using the Rabi model. (c) Ramsey spectrum of Yb clock transition (no averaging). The red line is a fit to the data using the Ramsey model.
    Fig. 2. (a) Atomic excitation rate as a function of probe time when the LO is resonant on the clock transition. The red line is a fit to the data. (b) Rabi spectrum of Yb clock transition (no averaging). The probe time is 200 ms (black dots) and 900 ms (blue squares in the inset). The solid lines are the fit to the data using the Rabi model. (c) Ramsey spectrum of Yb clock transition (no averaging). The red line is a fit to the data using the Ramsey model.
    (a) Timing sequence of interleaved measurement. Blue and red lines indicate two independent stabilizations. (b) Fractional frequency instability of the interleaved measurement when LO is frequency-stabilized to one of the π transitions using the Rabi spectrum (red circles) and the Ramsey spectrum (black squares). One-sigma error bars are shown. The Allan deviation fits to 5.4×10⁻¹⁶/τ.
    Fig. 3. (a) Timing sequence of interleaved measurement. Blue and red lines indicate two independent stabilizations. (b) Fractional frequency instability of the interleaved measurement when LO is frequency-stabilized to one of the π transitions using the Rabi spectrum (red circles) and the Ramsey spectrum (black squares). One-sigma error bars are shown. The Allan deviation fits to 5.4×10¹⁶/τ.
    The frequency instability of optical clocks limited by the Dick effect at 1 s averaging time as a function of interrogation time. The time for atomic preparation and population measurement is fixed to be 350 ms.
    Fig. 4. The frequency instability of optical clocks limited by the Dick effect at 1 s averaging time as a function of interrogation time. The time for atomic preparation and population measurement is fixed to be 350 ms.
    Yuxin Sun, Yuan Yao, Yaqin Hao, Hongfu Yu, Yanyi Jiang, Longsheng Ma. Laser stabilizing to ytterbium clock transition with Rabi and Ramsey spectroscopy[J]. Chinese Optics Letters, 2020, 18(7): 070201
    Download Citation