Abstract
A cavity-stabilized 578 nm laser is used to probe the clock transition of ytterbium atoms trapped in optical lattice sites. We obtain a Fourier-limited 4.2-Hz-linewidth Rabi spectrum and a Ramsey spectrum with fringe linewidth of 3.3 Hz. Based on one of the spectra, the 578 nm laser light is frequency-stabilized to the center of the transition to achieve a closed-loop operation of an optical clock. Based on interleaved measurement, the frequency instability of a single optical clock is demonstrated to be 5.4 × 10⁻¹⁶/√τ.Optical atomic clocks based on neutral atoms or single ions with narrow-linewidth optical transitions have been developing tremendously over the past two decades. The fractional frequency instability and uncertainty of optical clocks have reached and even [1−5]. Such optical clocks enable search for variations of fundamental constants[6], relativistic geodesy[5], test of fundamental symmetries[7], and detection of gravitational waves[8] and dark matter[9]. These exciting applications of optical clocks rely on accurate frequency comparison between optical clocks or accurate frequency measurement. For example, variations of fundamental constants and relativistic geodesy are explored by measuring the frequency ratios among optical clocks at different times and locations. The statistical uncertainty of frequency comparison or frequency measurement is determined by the statistical precision set by the frequency stability of optical clocks, generally quantified by the Allan deviation. In other words, optical clocks with high frequency stability enable precision frequency measurement at fast speeds, including characterization of systematic shifts of optical clocks and consequent reduction of those systematic shifts. For this reason, frequency stability represents one of the most important properties of a clock[10].
The frequency instability of an optical clock is ultimately limited by quantum project noise (QPN), which is given by[11]where is the averaging time, is the cycle time, is the quality of the clock transition (the ratio of transition frequency to transition linewidth ), and is the number of atoms. According to Eq. (1), optical clocks based on thousands of neutral atoms have lower QPN-limited frequency instabilities compared to those based on single trap ions. Considering typical operating conditions in this Letter, , , , and the frequency instability due to QPN is , which is attractive for precision measurement.
However, the frequency instability of an optical clock is usually limited by the Dick effect[12,13]. Since in each measurement cycle only a fraction of the cycle is used to interrogate with atoms, any phase noise from the local oscillator (LO) misread by the atoms due to limited probe time and non-uniform excitation sensitivity will give an unreal feedback signal back to the LO, thus degrading the frequency stability of the optical clock. The Allan deviation of optical clocks limited by the Dick effect, , is related to the LO frequency noise spectral density as[12]where is the Fourier coefficient of the instantaneous sensitivity of the final excitation rate to frequency over the interrogation time[14], and is when ( is an integer).
Sign up for Chinese Optics Letters TOC. Get the latest issue of Chinese Optics Letters delivered right to you!Sign up now
Recent advances of the LOs[2,10,14,15] have reduced by reducing the LO frequency noise and by increasing the interrogation time with atoms benefitting from improved LO coherence time, as indicated in Eq. (2). Meanwhile, improvements on the LOs also make a narrower-linewidth spectrum for locking, increasing the quality . Besides improvements on LOs, the sensitivity also affects the Dick effect[16]. By choosing the type of spectroscopy (e.g., Ramsey and Rabi) and by reducing the dark time in a cycle, the frequency instability of optical clocks can be improved. Laser frequency stabilizing to ytterbium (Yb) clock transition using Rabi spectroscopy has been explored in several groups[17−21]. With increased coherence time of both LOs and atoms, spectra of Yb clock transition with the narrowest linewidth of 1 Hz have been observed at NIST[5,14], achieving a clock frequency instability of . Ramsey spectroscopy of Yb clock transition has been performed at NIST[16]. A Ramsey spectrum with fringe linewidth of 1.9 Hz was observed, and it was used to stabilize LO frequency to obtain clock frequency instability of in an anti-synchronized mode[16].
In this Letter, we try to obtain a optical lattice clock with low frequency instability. Firstly, we use an improved LO with a frequency instability of at 1 s averaging time by stabilizing the 578 nm clock laser to a 30-cm-long optical cavity[22] to probe the clock transition of Yb atoms trapped in optical lattice sites. The Rabi spectrum of the Yb clock transition with a spectral linewidth of 1.2 Hz is observed. In order to compare the frequency instability achieved by Rabi spectroscopy and that achieved by Ramsey spectroscopy, we separately locked the LO to a 4.2-Hz-linewidth Rabi spectrum and a 3.3 Hz fringe-linewidth Ramsey spectrum. Based on interleaved measurements, the frequency instabilities of the Yb lattice clock are similar when using Rabi spectroscopy and Ramsey spectroscopy, which are .
Laser cooling and trapping Yb atoms is similar to other works[17−21]. Atoms of the isotope are slowed by using a slowing beam at 399 nm and magnetic field from a magneto-optical trap (MOT), as described in Ref. [23]. The 399 nm laser is frequency-stabilized to the Yb absorption signal in a hollow cathode lamp using the technique of modulation transfer spectroscopy. The slowed atoms are then loaded into a six-beam MOT on the transition at 399 nm with a linewidth of 28 MHz. They are further cooled in the second MOT on the transition at 556 nm with a narrower linewidth of 182 kHz. This phase is split into three steps, each with a unique optical power, laser detuning, and magnetic field gradient for high atomic density and low temperature. The 556 nm laser is frequency-stabilized to the resonance of an ultra-stable optical cavity made of ultra-low expansion glass. By the end of this phase, the temperature of the atoms in the MOT is roughly 8 μK, ready for loading into the optical lattice.
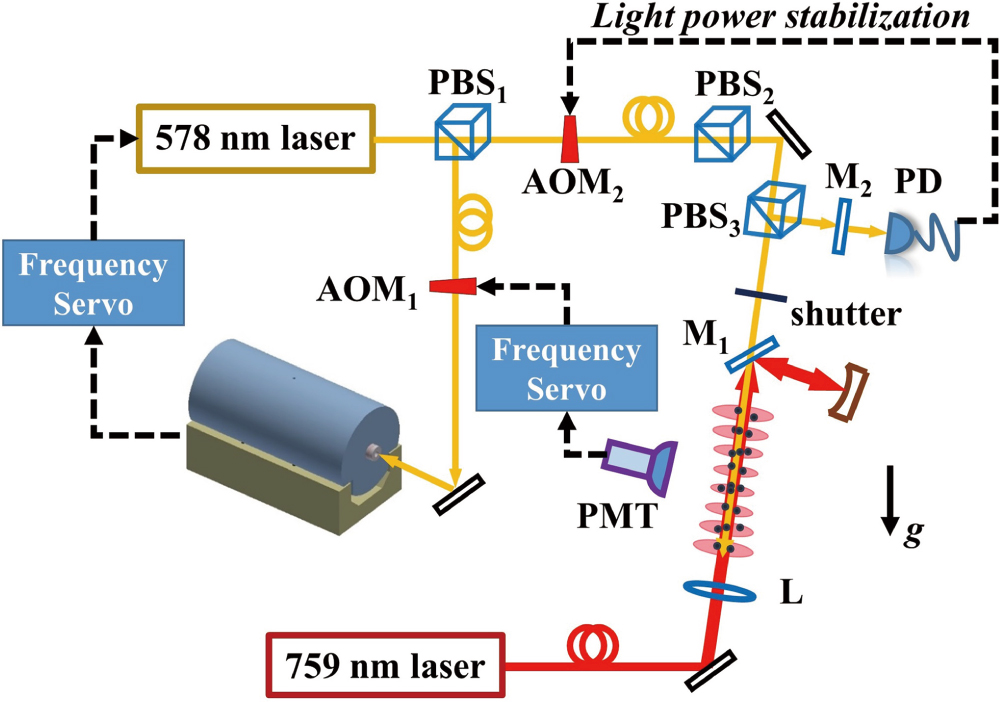
As shown in Fig. 1, light from a Ti:sapphire continuous wave laser at 759 nm is coupled into a piece of polarization maintenance (PM) optical fiber. As much as 600 mW laser light output from the fiber is focused by a lens, and it is retro-reflected by a curved mirror to build up an optical lattice with a trap depth of ( is recoil energy) and a diameter of 110 μm. The lattice light beam is formed vertically, but offset from the gravity by an angle of 5°. The atom number and lifetime in the optical lattice are roughly 20,000 and 4 s, accordingly. The time for laser cooling, trapping, and loading into the lattice is 260 ms in total.

Figure 1.Simplified experimental setup for lattice trapping, clock transition probing, and laser frequency locking. AOM, acousto-optic modulator; PBS, polarizing beam splitter; PMT, photomultiplier tube; PD, photodetector; L, lens.
During state preparation, laser light at 556 nm optically pumps the atoms to either one of the two Zeeman sub-states. Three pairs of Helmholtz coils are employed to cancel the static stray magnetic field in three directions and to provide a bias magnetic field to split the nuclear spin state degeneracy.
To probe the clock transition of Yb atoms, the 578 nm laser light is frequency-stabilized to a 30-cm-long optical cavity, yielding a laser frequency instability of at 1 s averaging time[22]. Two acousto-optic modulators ( and , as shown in Fig. 1) bridge the frequency gap between the cavity resonant mode and the atomic transition. The driving frequency of is mixed from a radio frequency (RF) synthesizer and a direct digital synthesizer (DDS). The frequency of the RF synthesizer can be swept to probe the clock transition of Yb atoms. The frequency of the DDS is adjusted to compensate the frequency drift of the 30-cm-long 578 nm optical cavity, which is typically below 0.05 Hz/s.
The cavity-stabilized 578 nm laser light is delivered to the atoms via another piece of PM optical fiber. At the output of the PM fiber, the 578 nm laser light passes through a polarizing beam splitter () to purify the light polarization, and it is split into two beams by . The reflected beam of is partially reflected on a mirror (). The partial reflected light of is back to and goes through the 578 nm PM optical fiber, and then it beats against the local light to generate an error signal in relation to phase noise induced by the optical fiber/path length random fluctuation. The error signal is fed back to by adjusting its driving frequency to compensate the light path fluctuation[24], while the transmission light of is monitored on a photodetector for light power stabilization by adjusting the RF driving power of . The transmitted beam of at 578 nm is combined with the lattice light on a dichroic mirror (). A shutter is placed between and to turn on/off the 578 nm probe light to atoms without interrupting the optical path stabilization. The polarizations of the 578 nm laser light and the 759 nm lattice laser light are oriented along the bias magnetic field . After probing the clock transition of Yb atoms, the populations in the and the states are measured in sequence using shelving detection[25].
In order to measure the coherence time of the atoms trapped in the lattice, we kept the LO frequency resonant on the atomic transition by changing the driving frequency of according to pre-measured LO frequency drift. The excitation rate of the Yb atoms was measured as a function of LO probe time, as shown in Fig. 2(a). By fitting the spectrum with an exponential function of , we obtain the coherence time of the atoms trapped in the lattice to be 460 ms, mainly limited by collision with other Yb atoms in the same lattice site[26]. With fewer atoms, can be increased. However, the signal to noise ratio (SNR) of the spectrum also decreases, which is not suitable for laser frequency stabilization.
Figure 2.(a) Atomic excitation rate as a function of probe time when the LO is resonant on the clock transition. The red line is a fit to the data. (b) Rabi spectrum of Yb clock transition (no averaging). The probe time is 200 ms (black dots) and 900 ms (blue squares in the inset). The solid lines are the fit to the data using the Rabi model. (c) Ramsey spectrum of Yb clock transition (no averaging). The red line is a fit to the data using the Ramsey model.
Next, we probed the clock transition of Yb atoms with Rabi spectroscopy by stepping the driving frequency of . In order to obtain a maximum excitation rate no less than 0.8, we kept the atomic probe time of 200 ms and a single cycle time of 550 ms, corresponding to a probe time to cycle time ratio of 36%. Figure 2(b) shows a normalized excitation spectrum of the transition with a spectral linewidth of 4.2 Hz (full width at half-maximum, FWHM) without averaging. The LO frequency was stepped by 0.5 Hz every cycle. Moreover, we repeated the Rabi spectroscopy eighteen times in the same condition. About 90% of the spectra have a linewidth between 3.5 Hz and 5 Hz, which is suitable for laser frequency stabilization. The maximum excitation rate of 0.83 in Fig. 2(b) is limited by the atomic interaction. To explore the limit of coherence time afforded by the LO, we probed the clock transition with a 900 ms interrogation time and stepped the LO frequency by 0.3 Hz every cycle. A spectrum with 1.2 Hz linewidth was obtained, as shown with blue squares in the inset of Fig. 2(b). However, the excitation rate of the spectrum is decreased to 0.4, unideal for laser frequency stabilization.
Meanwhile, we probed the clock transition with Ramsey spectroscopy by probing the atomic transition with two pulses of 17 ms and the free evolution time of 130 ms. The LO frequency was stepped by 0.5 Hz every cycle. As shown in Fig. 2(c) with black dots, each fringe has a linewidth of 3.2 Hz, and the central fringe has an excitation rate of 0.8, which is also suitable for laser frequency stabilization.
Based on one of the above spectra, we tuned the LO frequency to be resonant with the atomic transition, and we used the measured excitation rate () as a frequency discriminator to stabilize the LO to the atomic transition. Specially, we modulated the driving frequency of to make the LO frequency near two shoulders of the resonant peaks. After two cycles, we obtained an error signal ( is an integer), which was then fed to a digital proportional integral differential (PID) to generate a correction signal . The correction signal was added to the driving frequency of to keep the LO resonant on the atomic transition.
To anticipate the frequency instability of the optical clock in closed loop with the above single system, we made an interleaved measurement followed by Refs. [14] and [15]. As shown in Fig. 3(a), two independent PIDs were employed to separately calculate the correction signals and for feedback to . We obtain the frequency instability of a single clock using dataset, since in a single-clock operation the noise contribution and the cycle time are reduced[27,28]. Figure 3(b) shows the fractional frequency instability of a single clock when using Rabi spectroscopy (red dots) and Ramsey spectroscopy (black open squares). For each type of spectroscopy, the measurement takes more than 26 h. By fitting a white noise model, the anticipated frequency instability of the single clock can reach , shown with the blue line. To make it clear, since such an interleaved measurement is not sensitive to the shift of the clock transition due to environmental perturbations, it cannot represent the long-term frequency instability of a clock.
Figure 3.(a) Timing sequence of interleaved measurement. Blue and red lines indicate two independent stabilizations. (b) Fractional frequency instability of the interleaved measurement when LO is frequency-stabilized to one of the transitions using the Rabi spectrum (red circles) and the Ramsey spectrum (black squares). One-sigma error bars are shown. The Allan deviation fits to .
According to Eq. (2) and using parameters in this Letter, the clock frequency instability limited by the Dick effect when using Rabi spectroscopy (interrogation ) is slightly lower than that using Ramsey spectroscopy (), but they are close to at 1 s averaging time. With such interrogation time, the sensitivities for both spectroscopies are equally uniform. The frequency instabilities at 1 s averaging time shown in Fig. 3(b) are still four times higher than the Dick-effect-limited clock frequency instabilities, largely arising from some technical noises such as interaction between atoms and vibration-induced light path fluctuation. In the next step, we will reduce those technical noises and push the frequency stability of the Yb clock close to that limited by the Dick effect. Meanwhile, it is worth reducing the Dick noise by increasing the interrogation time. To ascertain which spectroscopy is better when the interrogation time is increased, we calculate the frequency instability induced by the Dick effect as a function of interrogation time, as shown in Fig. 4. Here, we keep the time for atomic preparation and population measurement to be 350 ms and use the same frequency noise of the LO in Ref. [17]. In the case of Rabi spectroscopy, the frequency instability of optical clocks at 1 s averaging time stops reducing when the integration time reaches 750 ms, corresponding to a probe time to cycle time ratio of 68%. While for Ramsey spectroscopy, the frequency instability of clocks at 1 s averaging time, , decreases continually. As interrogation time increases, the sensitivity for Ramsey spectroscopy gets more uniform than that for Rabi spectroscopy. Therefore, when the laser coherent time and the atomic coherent time are both longer than 200 ms, Ramsey spectroscopy is a better choice.
Figure 4.The frequency instability of optical clocks limited by the Dick effect at 1 s averaging time as a function of interrogation time. The time for atomic preparation and population measurement is fixed to be 350 ms.
In conclusion, a Yb lattice clock is developed. We lock the clock laser at the center of the clock transition with Rabi spectroscopy and Ramsey spectroscopy separately. In both cases, the frequency instabilities of the clock are measured to be based on the interleaved measurement. It is expected that the frequency instability of this lattice clock reaches after averaging time, provided that the frequency shifts of the atomic transition are kept stable in the long term. Such frequency stability of the optical clock supports the next step of characterization of systematic shifts at a fast speed.
References
[1] B. J. Bloom, T. L. Nicholson, J. R. Williams, S. L. Campbell, M. Bishof, X. Zhang, W. Zhang, S. L. Bromley, J. Ye. Nature, 506, 71(2014).
[2] E. Oelker, R. B. Huston, C. J. Kennedy, L. Sonderhouse, T. Bothwell, A. Goban, D. Kedar, C. Sanner, J. M. Robinson, G. E. Marti, T. Legero, M. Giunta, R. Holzwarth, R. Riehle, U. Sterr, J. Ye. Nat. Photon., 13, 714(2019).
[3] N. Huntemann, C. Sanner, B. Lipphardt, Chr Tamm, E. Peik. Phys. Rev. Lett., 116, 063001(2016).
[4] S. M. Brewer, J. S. Chen, A. M. Hankin, E. R. Clements, C. W. Chou, D. J. Wineland, D. B. Hume, D. R. Leihrandt. Phys. Rev. Lett., 123, 033201(2019).
[5] W. F. McGrew, X. Zhang, R. J. Fasano, S. A. Schäffer, K. Beloy, D. Nicolodi, R. C. Brown, N. Hinkley, G. Milani, M. Schioppo, T. H. Yoon, A. D. Ludlow. Nature, 564, 87(2018).
[6] M. S. Safronova, D. Budker, D. DeMille, D. F. J. Kimball, A. Derevianko, C. W. Clark. Rev. Mod. Phys., 90, 025008(2018).
[7] C. Sanner, N. Huntemann, R. Lange, C. Tamm, E. Peik, M. S. Safronova, S. G. Porsev. Nature, 567, 204(2019).
[8] S. Kolkowitz, I. Pikovski, N. Langellier, M. D. Lukin, R. L. Walsworth, J. Ye. Phys. Rev. D, 94, 124043(2016).
[9] B. M. Roberts, G. Blewitt, C. Dailey, M. Murphy, M. Pospelov, A. Rollings, J. Sherman, W. Williams, A. Derevianko. Nat. Commun., 8, 1195(2017).
[10] N. Hinkley, J. A. Sherman, N. B. Phillips, M. Schioppo, N. D. Lemke, K. Beloy, M. Pizzocaro, C. W. Oates, A. D. Ludlow. Science, 341, 1215(2013).
[11] W. M. Itano, J. C. Bergquist, J. J. Bollinger, J. M. Gilligan, D. J. Heinzen, F. L. Moore, M. G. Raizen, D. J. Wineland. Phys. Rev. A, 47, 3554(1993).
[12] G. Santarelli, C. Audoin, A. Makdissi, P. Laurent, G. J. Dick, A. Clairon. IEEE Trans. Ultrason. Ferroelectr. Freq. Control, 45, 887(1998).
[13] G. J. Dick, J. D. Prestage, C. A. Greenhall, L. Maleki, 487(1990).
[14] Y. Y. Jiang, A. D. Ludlow, N. D. Lemke, R. W. Fox, J. A. Sherman, L. S. Ma, C. W. Oates. Nat. Photon., 5, 158(2011).
[15] Y. Li, Y. Lin, Q. Wang, T. Yang, Z. Sun, E. Zang, Z. Fang. Chin. Opt. Lett., 16, 051402(2018).
[16] M. Schippo, R. C. Brown, W. F. McGrew, N. Hinkley, R. J. Fasano, K. Beloy, T. H. Yoon, G. Milani, D. Nicolodi, J. A. Sherman, N. B. Phillips, C. W. Oates, A. D. Ludlow. Nat. Photon., 11, 48(2017).
[17] Q. Gao, M. Zhou, C. Han, S. Li, S. Zhang, Y. Yao, B. Li, H. Qiao, D. Ai, G. Lou, M. Zhang, Y. Jiang, Z. Bi, L. Ma, X. Xu. Sci. Rep., 8, 8022(2018).
[18] N. D. Lemke, A. D. Ludlow, Z. W. Baber, T. M. Fortier, S. A. Diddams, Y. Jiang, S. R. Jefferts, T. P. Heavner, T. E. Parker, C. W. Oates. Phys. Rev. Lett., 103, 063001(2009).
[19] M. Pizzocaro, P. Thoumany, B. Rauf, F. Bregolin, G. Milani, C. Clivati, G. A. Costanzo, F. Levi. Metrologia, 54, 102(2017).
[20] C. Y. Park, D.-H. Yu, W.-K. Lee, S. E. Park, E. B. Kim, S. K. Lee, J. W. Cho, T. H. Yoon, J. Mun, S. J. Park, T. Y. Kwon, S.-B. Lee. Metrologia, 50, 119(2013).
[21] M. J. Zhang, H. Liu, X. Zhang, K.-L. Jiang, Z.-X. Xiong, B.-L. Lu, L.-X. He. Chin. Phys. Lett., 33, 070601(2016).
[22] L. Jin, Y. Jiang, Y. Yao, H. Yu, Z. Bi, L. Ma. Opt. Express, 26, 18699(2018).
[23] W. Yan, Y. Yao, Y. Sun, H. W. Chad, Y. Jiang, L. Ma. Chin. Opt. Lett., 17, 040201(2019).
[24] L. Ma, P. Jungner, J. Ye, J. L. Hall. Opt. Lett., 19, 1777(1994).
[25] W. Nagourney, J. Sandberg, H. Dehmelt. Phys. Rev. Lett., 56, 2797(1986).
[26] M. J. Martin, M. Bishof, M. D. Swallows, X. Zhang, C. Benko, J. von Stecher, A. V. Gorshkov, A. M. Rey, J. Ye. Science, 341, 632(2013).
[27] T. L. Nicholson, M. J. Martin, J. R. Williams, B. J. Bloom, M. Bishof, M. D. Swallows, S. L. Campbell, J. Ye. Phys. Rev. Lett., 109, 230801(2012).
[28] C. Hagemann, C. Grebing, T. Kessler, S. Falke, N. Lemke, C. Lisdat, H. Schnatz, F. Riehle, U. Sterr. IEEE Trans. Instrum. Meas, 62, 1556(2013).