
Yang Sun, Yongyou Zhang. Application Condition of Effective Medium Theory in Optical Composite System[J]. Acta Optica Sinica, 2023, 43(5): 0524001
- Acta Optica Sinica
- Vol. 43, Issue 5, 0524001 (2023)
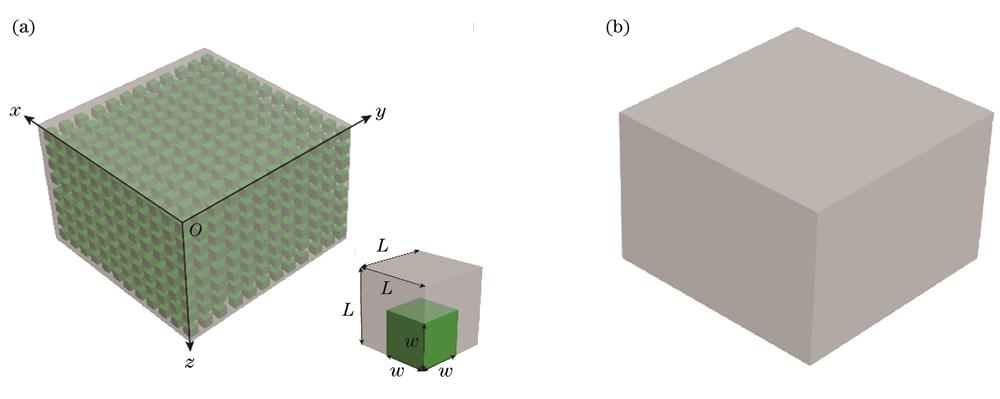
Fig. 1. Schematic diagram of nanocrystal-doped composite crystal structure and equivalent crystal model. (a) Schematic diagram of nanocrystal-doped composite crystal structure; (b) equivalent crystal model
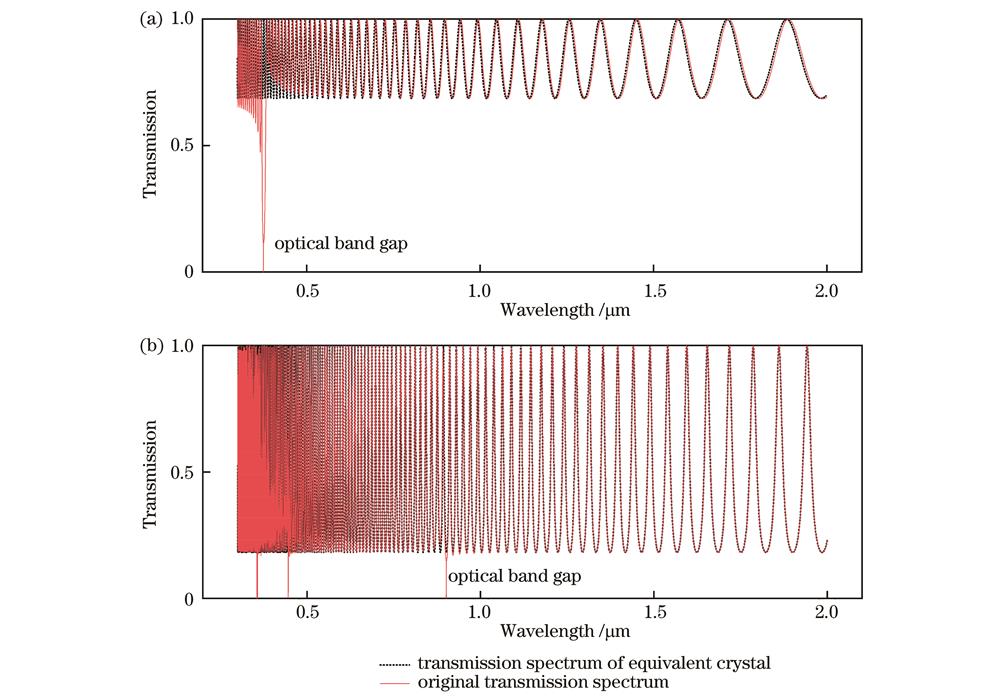
Fig. 2. Original transmission spectra of composite system and transmission spectra of equivalent crystal under different parameters. (a)
Fig. 3.
Fig. 4.
Fig. 5. Wavelength dependence of effective dielectric constant and comparison of transmission spectra. (a)(c) Effective dielectric constant computed by transfer-matrix method varying with wavelength and


Set citation alerts for the article
Please enter your email address

© Copyright 2018-2021 | Chinese Laser Press. All Rights Reserved 沪ICP备15018463号-20