• Spectroscopy and Spectral Analysis
  • Vol. 42, Issue 11, 3631 (2022)
You-rui SUN1、*, Mei GUO1、*, Gui-shan LIU1、1; *;, Nai-yun FAN1、1; *;, Hao-nan ZHANG2、2;, Yue LI1、1;, Fang-ning PU2、2;, Shi-hu YANG1、1;, and Hao WANG2、2;
Author Affiliations
  • 11. College of Food and Wine, Ningxia University, Yinchuan 750021, China
  • 22. School of Physics and Electronic-Electrical Engineering, Ningxia University, Yinchuan 750021, China
  • show less
    DOI: 10.3964/j.issn.1000-0593(2022)11-3631-06 Cite this Article
    You-rui SUN, Mei GUO, Gui-shan LIU, Nai-yun FAN, Hao-nan ZHANG, Yue LI, Fang-ning PU, Shi-hu YANG, Hao WANG. Fusion of Visible Near-Infrared (VNIR) Hyperspectral Imaging and Texture Feature for Prediction of Total Phenolics Content in Tan Mutton[J]. Spectroscopy and Spectral Analysis, 2022, 42(11): 3631 Copy Citation Text show less
    Spectral curves of Tan mutton samples
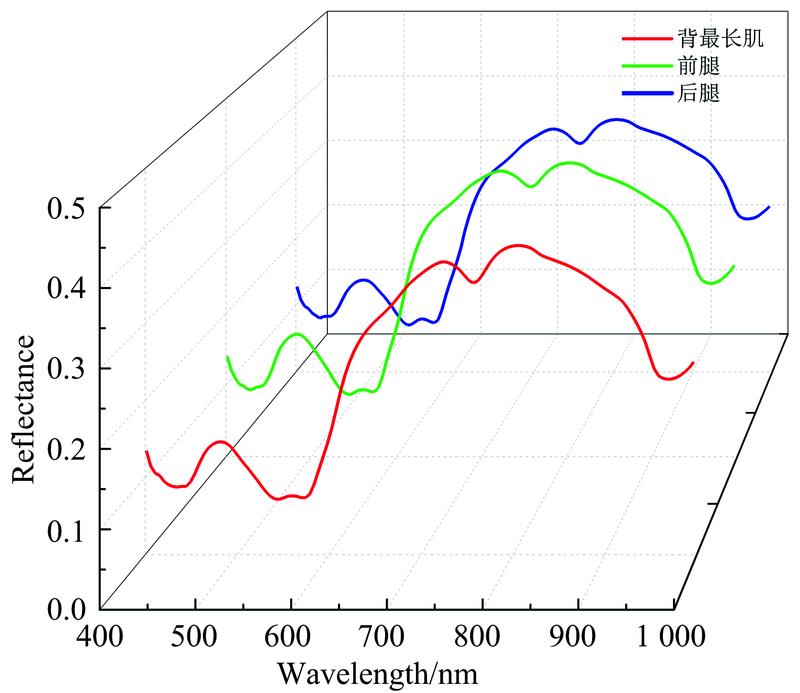
    Fig. 1. Spectral curves of Tan mutton samples
    Performances of full wavelength models based on different pre-processing methods
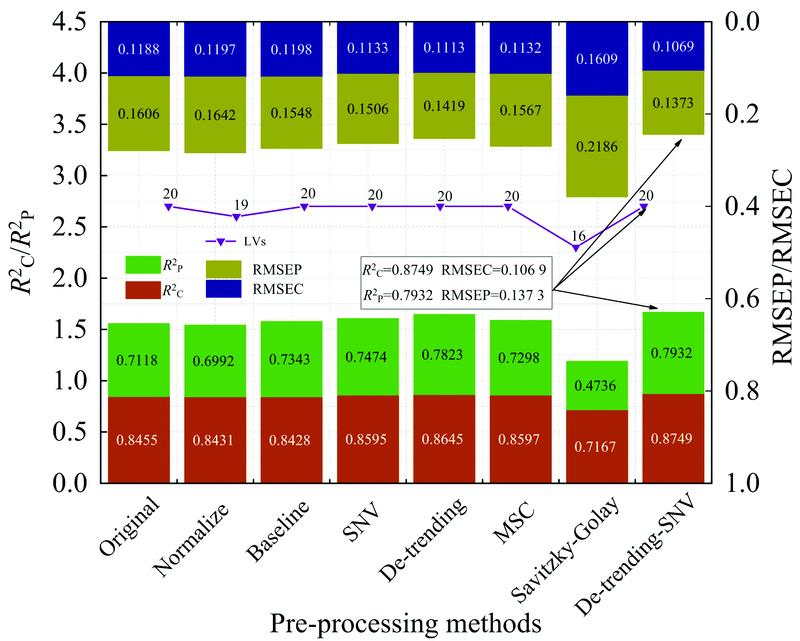
    Fig. 2. Performances of full wavelength models based on different pre-processing methods
    Selection of the characteristic wavelengths(a): Change curve of mean weight value and the distribution map based on BOSS algorithm;(b): Change curve of mean weight value by CARS algorithm; (c): Changes map of RMSECV by VCPA-IRIV algorithm;(d): Distribution maps based on the characteristic wavelengths extracted by VCPA-IRIV and iVISSA
    Fig. 3. Selection of the characteristic wavelengths
    (a): Change curve of mean weight value and the distribution map based on BOSS algorithm;(b): Change curve of mean weight value by CARS algorithm; (c): Changes map of RMSECV by VCPA-IRIV algorithm;(d): Distribution maps based on the characteristic wavelengths extracted by VCPA-IRIV and iVISSA
    The images of first three PCs of mutton samples
    Fig. 4. The images of first three PCs of mutton samples
    Visualizaion maps of TPC content distributions
    Fig. 5. Visualizaion maps of TPC content distributions
    Modeling methodsSelection methodLVsCalibration setPrediction set
    RC2RMSECRP2RMSEP
    PLSRCARS160.763 40.147 50.657 80.175 5
    BOSS200.825 20.126 30.738 60.154 1
    iVISSA200.852 60.116 00.735 70.156 4
    VCPA-IRIV190.737 00.154 90.609 60.186 8
    LSSVMCARS/0.790 60.138 40.700 20.164 9
    BOSS/0.851 30.116 80.745 90.155 0
    iVISSA/0.896 80.097 50.714 20.162 6
    VCPA-IRIV/0.740 00.154 40.586 10.192 4
    Table 1. Model performances based on different feature-wavelength methods
    Modeling
    methods
    Selection methodLVsCalibration setPrediction set
    RC2RMSECRP2RMSEP
    PLSRBOSS-COR200.825 60.126 20.718 40.159 8
    BOSS-ASM-CON200.812 70.131 00.755 80.152 7
    BOSS-ASM-ENT-CON200.808 50.131 40.761 40.151 0
    BOSS-COR-ASM-ENT-CON200.807 40.132 80.742 40.157 8
    LSSVMBOSS-COR/0.858 10.114 00.751 20.150 5
    BOSS-ASM-CON/0.854 40.115 40.747 70.152 2
    BOSS-ASM-ENT-CON/0.850 00.116 00.770 90.144 7
    BOSS-COR-ASM-ENT-CON/0.857 20.114 30.757 80.148 5
    Table 2. Model performance based on image and spectroscopy fusion
    You-rui SUN, Mei GUO, Gui-shan LIU, Nai-yun FAN, Hao-nan ZHANG, Yue LI, Fang-ning PU, Shi-hu YANG, Hao WANG. Fusion of Visible Near-Infrared (VNIR) Hyperspectral Imaging and Texture Feature for Prediction of Total Phenolics Content in Tan Mutton[J]. Spectroscopy and Spectral Analysis, 2022, 42(11): 3631
    Download Citation